| |||||||||||||||||
| Turnout | 67.63% | ||||||||||||||||
|---|---|---|---|---|---|---|---|---|---|---|---|---|---|---|---|---|---|
| |||||||||||||||||


.svg)
Sununu: 40–50% 50–60% 60–70% 70–80% 80–90% >90% Sherman: 40–50% 50–60% 60–70% 70–80% >90% | |||||||||||||||||
| |||||||||||||||||


| Elections in New Hampshire |
|---|
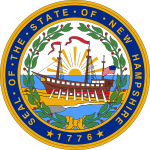 |
The 2022 New Hampshire gubernatorial election was held on November 8, 2022, to elect the governor of New Hampshire. As New Hampshire does not have gubernatorial term limits, incumbent Republican Governor Chris Sununu won re-election to a fourth two-year term in office against Democratic nominee Tom Sherman, with a 15.5% margin.
Sununu had "expressed interest" in running for the U.S. Senate in 2022 against incumbent Democrat (and former governor) Maggie Hassan. However, on November 9, 2021, he announced that he would instead run for a fourth term as governor. [1] Sununu became the first Republican to win a fourth term as governor, also tying John Lynch's modern record of four terms overall.
Republican primary
Candidates
Nominee
- Chris Sununu, incumbent governor [1]
Eliminated in primary
- Julian Acciard, security specialist, Iraq War veteran, and former candidate for New Hampshire's 1st Congressional district in 2022 [2]
- Jay Lewis, Laconia resident [3]
- Richard McMenamon II [4]
- Thad Riley, entrepreneur, former Brentwood school board member and community advocate [5]
- Karen Testerman, former Franklin city councilor and candidate for governor in 2020 [6]
Declined
- Kelly Ayotte, former U.S. senator [7]
- Scott Brown, former U.S. senator from Massachusetts and nominee for U.S. Senate in 2014 [8]
Endorsements
Chris Sununu
- Organizations
Polling
| Poll source | Date(s) administered |
Sample size [a] |
Margin of error |
Thad Riley |
Chris Sununu |
Karen Testerman |
Other | Undecided |
|---|---|---|---|---|---|---|---|---|
| University of New Hampshire | August 25–29, 2022 | 892 (LV) | ± 3.3% | 7% | 72% | 5% | 2% [b] | 14% |
| Saint Anselm College | August 9–11, 2022 | 820 (RV) | ± 3.4% | 5% | 68% | 6% | 2% | 19% |
Hypothetical polling
| Poll source | Date(s) administered |
Sample size [a] |
Margin of error |
Kelly Ayotte |
Scott Brown |
Frank Edelbut |
Chuck Morse |
Undecided |
|---|---|---|---|---|---|---|---|---|
| Praecones Analytica | August 13–20, 2021 | 792 (LV) | ± 3.5% | 46% | 13% | 7% | 6% | 29% |
Results

Sununu
- 70–80%
- 80–90%
| Party | Candidate | Votes | % | |
|---|---|---|---|---|
| Republican | Chris Sununu (incumbent) | 113,443 | 78.66% | |
| Republican | Karen Testerman | 14,473 | 10.04% | |
| Republican | Thaddeus Riley | 11,107 | 7.70% | |
| Republican | Julian Acciard | 2,906 | 2.01% | |
| Republican | Jay Lewis | 1,318 | 0.91% | |
| Republican | Richard McMenamon II | 817 | 0.57% | |
| Write-in | 160 | 0.11% | ||
| Total votes | 144,224 | 100.0% | ||
Democratic primary
Candidates
Nominee
- Tom Sherman, state senator from the 24th district [11]
Declined
- Dan Feltes, former majority leader of the New Hampshire Senate from the 15th district and nominee for governor in 2020 [12] (moved out of state in 2021)
- John Lynch, former governor [13]
- Jodi Picoult, author [14]
- Andru Volinsky, former Executive Councilor and candidate for governor in 2020 [15]
- Cinde Warmington, Executive Councilor (running for re-election) [3]
Endorsements
Tom Sherman
- Organizations
- American Federation of Teachers New Hampshire [16]
- National Education Association New Hampshire [17]
Results
| Party | Candidate | Votes | % | |
|---|---|---|---|---|
| Democratic | Tom Sherman | 82,607 | 97.57% | |
| Republican | Chris Sununu (incumbent) (write-in) | 1,963 | 2.32% | |
| Write-in | 95 | 0.11% | ||
| Total votes | 84,665 | 100.0% | ||
Other candidates
Libertarian Party
Nominees
General election
Predictions
| Source | Ranking | As of |
|---|---|---|
| The Cook Political Report [19] | Solid R | March 4, 2022 |
| Inside Elections [20] | Solid R | September 23, 2022 |
| Sabato's Crystal Ball [21] | Safe R | August 18, 2022 |
| Politico [22] | Solid R | November 3, 2022 |
| RCP [23] | Safe R | June 8, 2022 |
| Fox News [24] | Likely R | May 12, 2022 |
| 538 [25] | Solid R | August 26, 2022 |
| Elections Daily [26] | Safe R | November 7, 2022 |
Endorsements
Chris Sununu (R)
- U.S. executive branch officials
- Nikki Haley, United States Ambassador to the United Nations (2017–2018) and Governor of South Carolina (2011–2017) [27]
- Organizations
- Humane Society Legislative Fund [28]
- NRA Political Victory Fund [9]
Tom Sherman (D)
- U.S. senators
- Maggie Hassan, U.S. senator from New Hampshire (2017–present) and Governor of New Hampshire (2013–2017) [29]
- Jeanne Shaheen, U.S. senator from New Hampshire (2009–present) and Governor of New Hampshire (1997–2003) [29]
- U.S. representatives
- Annie Kuster, U.S. Representatives for New Hampshire's 2nd congressional district (2013–present) [29]
- Chris Pappas, U.S. Representatives for New Hampshire's 1st congressional district (2019–present) [29]
- Organizations
- American Federation of Teachers New Hampshire [30]
- National Education Association New Hampshire [17]
Polling
- Aggregate polls
| Source of poll aggregation |
Dates administered |
Dates updated |
Chris Sununu (R) |
Tom Sherman (D) |
Other [c] |
Margin |
|---|---|---|---|---|---|---|
| Real Clear Politics | October 28 – November 6, 2022 | November 8, 2022 | 56.4% | 39.4% | 4.2% | Sununu +17.0 |
| FiveThirtyEight | September 15, 2021 – November 8, 2022 | November 8, 2022 | 55.4% | 39.0% | 5.6% | Sununu +16.4 |
| Average | 55.9% | 39.2% | 4.9% | Sununu +16.7 | ||
- Graphical summary
Graphs are unavailable due to technical issues. There is more info on
Phabricator and on
MediaWiki.org. |
| Poll source | Date(s) administered |
Sample size [a] |
Margin of error |
Chris Sununu (R) |
Tom Sherman (D) |
Other | Undecided |
|---|---|---|---|---|---|---|---|
| Phillips Academy | November 5–6, 2022 | 1,056 (LV) | ± 3.0% | 58% | 36% | – | 6% |
| University of New Hampshire | November 2–6, 2022 | 2,077 (LV) | ± 2.2% | 55% | 43% | 2% [d] | <1% |
| InsiderAdvantage (R) [A] | November 5, 2022 | 700 (LV) | ± 3.7% | 56% | 40% | 2% [e] | 2% |
| Data for Progress (D) | November 2–5, 2022 | 1,995 (LV) | ± 2.0% | 58% | 40% | 2% [f] | – |
| Wick Insights | November 2–5, 2022 | 725 (LV) | ± 3.6% | 53% | 43% | 2% [g] | 2% |
| Emerson College | October 30 – November 1, 2022 | 850 (LV) | ± 3.3% | 57% | 36% | 4% [h] | 4% |
| 58% | 37% | 6% [i] | – | ||||
| Saint Anselm College | October 28–29, 2022 | 1,541 (LV) | ± 2.5% | 55% | 37% | 2% [j] | 6% |
| co/efficient (R) | October 25–26, 2022 | 1,098 (LV) | ± 3.2% | 52% | 34% | 5% [k] | 8% |
| UMass Lowell/YouGov | October 14–25, 2022 | 600 (LV) | ± 5.1% | 51% | 35% | 12% [l] | 2% |
| InsiderAdvantage (R) [A] | October 23, 2022 | 600 (LV) | ± 4.0% | 54% | 37% | 4% [m] | 6% |
| Emerson College | October 18–19, 2022 | 727 (LV) | ± 3.6% | 52% | 40% | 3% [n] | 5% |
| 54% | 41% | 4% [o] | – | ||||
| Fabrizio, Lee & Associates (R) [B] | October 17–19, 2022 | 600 (LV) | – | 57% | 40% | – | 4% |
| Data for Progress (D) | October 14–19, 2022 | 1,392 (LV) | ± 3.0% | 53% | 40% | 3% [p] | 4% |
| Fabrizio Ward (R)/Impact Research (D) | October 2–6, 2022 | 500 (LV) | ± 4.4% | 55% | 41% | 1% | 3% |
| Data for Progress (D) | September 23–30, 2022 | 1,147 (LV) | ± 3.0% | 52% | 39% | 4% [q] | 5% |
| Saint Anselm College | September 27–28, 2022 | 901 (RV) | ± 3.3% | 50% | 34% | 5% [r] | 11% |
| Suffolk University | September 23–26, 2022 | 500 (LV) | ± 4.4% | 53% | 36% | 4% [s] | 8% |
| American Research Group | September 15–19, 2022 | 555 (RV) | ± 4.2% | 53% | 38% | – | 9% |
| University of New Hampshire | September 15–19, 2022 | 870 (LV) | ± 3.3% | 55% | 37% | 1% [t] | 8% |
| Emerson College | September 14–15, 2022 | 800 (LV) | ± 3.4% | 52% | 37% | 4% [u] | 7% |
| Saint Anselm College | August 9–11, 2022 | 1,898 (RV) | ± 2.3% | 48% | 29% | 4% | 18% |
| Public Policy Polling (D) [C] | July 5–6, 2022 | 601 (LV) | ± 4.0% | 43% | 33% | 8% [v] | 16% |
| University of New Hampshire | April 14–18, 2022 | 868 (LV) | ± 3.5% | 55% | 29% | 1% | 14% |
| Phillips Academy | April 4–8, 2022 | 533 (A) | ± 4.2% | 62% | 24% | – | 14% |
| 471 (RV) | ± 4.5% | 73% | 24% | – | 3% | ||
| Saint Anselm College | March 23–24, 2022 | 1,265 (RV) | ± 2.8% | 51% | 24% | 10% | 15% |
Hypothetical polling
- Chris Sununu vs. generic opponent
| Poll source | Date(s) administered |
Sample size [a] |
Margin of error |
Chris Sununu (R) |
Generic Opponent |
Undecided |
|---|---|---|---|---|---|---|
| Saint Anselm College | January 11–12, 2022 | 1,215 (RV) | ± 2.8% | 45% | 45% | 10% |
Results
| Party | Candidate | Votes | % | ±% | |
|---|---|---|---|---|---|
| Republican | Chris Sununu (incumbent) | 352,813 | 56.98% | -8.14% | |
| Democratic | Tom Sherman | 256,766 | 41.47% | +8.11% | |
| Libertarian | Kelly Halldorson | 5,071 | 0.82% | N/A | |
| Libertarian | Karlyn Borysenko | 2,772 | 0.45% | N/A | |
| Write-in | 1,713 | 0.28% | +0.19% | ||
| Total votes | 619,135 | 100.0% | |||
| Turnout | 626,845 | 67.63% | |||
| Registered electors | 925,401 | ||||
| Republican hold | |||||
By county
By county
| ||||||||||||||||||||||||||||||||||||||||||||||||||||||||||||||||||||||||||||||||||||||||||||||||||||||||
|---|---|---|---|---|---|---|---|---|---|---|---|---|---|---|---|---|---|---|---|---|---|---|---|---|---|---|---|---|---|---|---|---|---|---|---|---|---|---|---|---|---|---|---|---|---|---|---|---|---|---|---|---|---|---|---|---|---|---|---|---|---|---|---|---|---|---|---|---|---|---|---|---|---|---|---|---|---|---|---|---|---|---|---|---|---|---|---|---|---|---|---|---|---|---|---|---|---|---|---|---|---|---|---|---|
 
| ||||||||||||||||||||||||||||||||||||||||||||||||||||||||||||||||||||||||||||||||||||||||||||||||||||||||
See also
- Elections in New Hampshire
- Political party strength in New Hampshire
- New Hampshire Democratic Party
- New Hampshire Republican Party
- Government of New Hampshire
- 2022 United States Senate election in New Hampshire
- 2022 United States House of Representatives elections in New Hampshire
- 2022 New Hampshire House of Representatives election
- 2022 New Hampshire Senate election
- 2022 New Hampshire elections
- 2022 United States gubernatorial elections
- 2022 United States elections
Notes
- ^
a
b
c
d Key:
A – all adults
RV – registered voters
LV – likely voters
V – unclear - ^ Acciard and "Other" with 1%
- ^ Calculated by taking the difference of 100% and all other candidates combined.
- ^ Halldorson (L) with 1%; "Another candidate" with 1%; Borysenko (L) with <1%
- ^ "Someone else" with 2%
- ^ Halldorson (L) with 2%
- ^ "Someone else" with 2%
- ^ Borysenko (L) with 2%; Halldorson (L) with 1%; "Someone else" with 1%
- ^ Borysenko (L) with 2%; Halldorson (L) with 2%; "Someone else" with 2%
- ^ Borysenko (L) with 1%; Halldorson (L) with 1%
- ^ Borysenko (L) with 4%; Halldorson (L) with 1%
- ^ Halldorson (L) with 5%; Borysenko (L) with 2%; "Another candidate" with 5%
- ^ "Someone else" with 4%
- ^ "Someone else" with 2%; Halldorson (L) with 1%; Borysenko (L) with <1%
- ^ "Someone else" with 3%; Halldorson (L) with 1%; Borysenko (L) with <1%
- ^ Halldorson (L) with 3%
- ^ Halldorson (L) with 4%
- ^ "Someone else" with 5%
- ^ Borysenko (L) with 2%; Halldorson (L) with 2%
- ^ Borysenko (L) with 1%
- ^ "Someone else" with 4%
- ^ Borysenko (L) with 8%
- Partisan clients
- ^ a b Poll conducted for American Greatness, a conservative news and opinions site.
- ^ This poll was sponsored by Bolduc's campaign, the Republican nominee for U.S. Senate.
- ^ Poll sponsored by Sherman's campaign
References
- ^ a b "New Hampshire Gov. Chris Sununu Not Running For US Senate, Will Seek 4th Term As Governor". CBS Boston. November 9, 2021. Archived from the original on November 9, 2021. Retrieved November 9, 2021.
- ^ "Acciard Leaves NH-01 Race to Challenge Sununu in Primary". NH Journal. May 5, 2022. Retrieved May 21, 2022.
- ^ a b "Welcome". New Hampshire Secretary of State.
- ^ "2022 Republican Cumulative Filings". New Hampshire Secretary of State. Retrieved July 7, 2022.
- ^ Bailey, Kathleen D. (November 3, 2021). "Ex-Brentwood School Board member runs for NH governor, criticizes Sununu, vaccine mandates". The Portsmouth Herald. Gannett. Archived from the original on November 6, 2021. Retrieved November 6, 2021.
- ^ DiStaso, John (July 29, 2021). "NH Primary Source: Karen Testerman, running again for governor, says, 'I'm not a protest candidate'". WMUR-TV. Archived from the original on July 29, 2021. Retrieved July 30, 2021.
- ^ DiStaso, John [@jdistaso] (November 9, 2021). "BREAKING: Sources close to former Sen @KellyAyotte tell @WMUR9 she "will NOT be a candidate for any office in 2022…." Ayotte "thankful" @ChrisSununu ChrisSununu "will continue his service to our state." #nhsen #NHgov #NHPolitics #WMUR" ( Tweet). Retrieved November 9, 2021 – via Twitter.
- ^ DiStaso, John [@jdistaso] (November 9, 2021). "Now: @SenScottBrown has essentially taken himself out of the running for the #nhsen seat, says he wants to focus on his wife, @gailhuffbrown in her bid for #nh01 - His comments to @WMUR9 below #nhpolitics #WMUR" ( Tweet). Retrieved November 9, 2021 – via Twitter.
- ^
a
b
"New Hampshire Grades & Endorsements". nrapvf.org. NRA-PVF. Archived from the original on November 8, 2022. Retrieved February 15, 2023.
{{
cite web}}
: CS1 maint: unfit URL ( link) - ^ a b "2022 State Primary Election Results". New Hampshire Department of State.
- ^ "NH state Sen. Tom Sherman exploring gubernatorial run". Associated Press. February 15, 2022. Archived from the original on February 15, 2022. Retrieved February 15, 2022.
- ^ Steinhauser, Paul (October 29, 2021). "On the trail: Who would replace Sununu in governor's office?". Concord Monitor. Archived from the original on November 3, 2021. Retrieved November 6, 2021.
- ^ DiStaso, John (November 11, 2021). "Former Gov. John Lynch says he's 'not even considering' running for governor again". WMUR-TV. Archived from the original on November 12, 2021. Retrieved November 15, 2021.
-
^ Sexton, Adam (April 14, 2021).
"Progressive activists try to recruit author Picoult into run for governor".
WMUR-TV. Concord, N.H.
Archived from the original on April 15, 2021. Retrieved June 20, 2021.
Picoult announced on Wednesday evening via Twitter that she would not be running for governor.
- ^ "Franklin Pierce University Names Andru Volinsky as its First Civic Scholar-In-Residence".
- ^ Staff Report (August 24, 2022). "Sherman Outraises Sununu; Wins AFT-NH Endorsement". InDepthNH. Retrieved August 27, 2022.
- ^ a b Sexton, Adam (August 2, 2022). "New Hampshire's largest teachers union endorses Democrat Sherman for governor". WMUR9. Retrieved August 27, 2022.
- ^ a b "Nh sos".[ permanent dead link]
- ^ "2022 Governor Race Ratings". The Cook Political Report. Retrieved January 14, 2021.
- ^ "Gubernatorial Ratings". Inside Elections. Retrieved February 19, 2021.
- ^ "2022 Gubernatorial race ratings". Sabato's Crystal Ball. Retrieved March 11, 2021.
- ^ "New Hampshire Governor Race 2022". Politico. April 1, 2022.
- ^ "2022 Governor Races". RCP. January 10, 2022. Retrieved January 10, 2022.
- ^ "2022 Election Forecast". Fox News. May 12, 2022. Retrieved May 12, 2022.
- ^ "2022 Election Forecast". FiveThirtyEight. June 30, 2022. Retrieved June 30, 2022.
- ^ Szymanski, Joe (November 7, 2022). "Elections Daily Unveils Final 2022 Midterm Ratings". Elections Daily. Retrieved November 28, 2022.
- ^ "Haley endorses Sununu, Bolduc; heading to New Hampshire this week to join them on campaign trail". Fox News. September 19, 2022.
- ^ "Chris Sununu's Ratings and Endorsements". justfacts.votesmart.org. Retrieved October 27, 2022.
- ^ a b c d "Congressional Delegation Endorses Tom Sherman for Governor". October 18, 2022.
- ^ "Sherman Outraises Sununu; Wins AFT-NH Endorsement". InDepthNH. August 24, 2022. Retrieved August 27, 2022.
- ^ "2022 General Election Results". New Hampshire Department of State.
- ^ "2022 General Election Results".
External links
- Official campaign websites