
Size of this preview:
706 × 600 pixels. Other resolutions:
283 × 240 pixels |
565 × 480 pixels |
905 × 768 pixels |
1,206 × 1,024 pixels |
2,128 × 1,807 pixels.
Original file (2,128 × 1,807 pixels, file size: 522 KB, MIME type: image/jpeg)
| This is a file from the
Wikimedia Commons. Information from its
description page there is shown below. Commons is a freely licensed media file repository. You can help. |
Summary
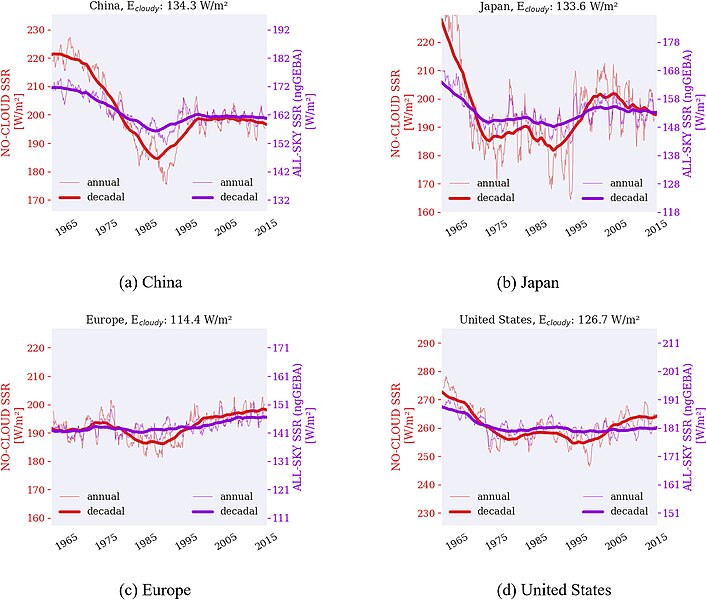
This scientific graphic from Julsrud et al., 2022 shows the observed trends of w:global dimming and brightening in four major geopolitical regions. It also demonstrates that the difference had nothing to do with w:cloud cover trends, as the dimming is greater on the average cloud-free days (red line) than on the average of all days (purple line).
Licensing
This file is licensed under the
Creative Commons
Attribution 4.0 International license.
- You are free:
- to share – to copy, distribute and transmit the work
- to remix – to adapt the work
- Under the following conditions:
- attribution – You must give appropriate credit, provide a link to the license, and indicate if changes were made. You may do so in any reasonable manner, but not in any way that suggests the licensor endorses you or your use.
File history
Click on a date/time to view the file as it appeared at that time.
| Date/Time | Thumbnail | Dimensions | User | Comment | |
|---|---|---|---|---|---|
| current | 10:53, 17 December 2023 |
| 2,128 × 1,807 (522 KB) | InformationToKnowledge | This scientific graphic from [Julsrud et al., 2022] shows the observed trends of global dimming and brightening in four major geopolitical regions. It also demonstrates that the difference had nothing to do with cloud cover trends, as the dimming is greater on the average cloud-free days (red line) than on the average of all days (purple line). |
File usage
The following pages on the English Wikipedia use this file (pages on other projects are not listed):