One third of Stevenage Borough Council in Hertfordshire, England is elected each year, followed by one year when there is an election to Hertfordshire County Council instead.
Council elections
- 1973 Stevenage Borough Council election
- 1976 Stevenage Borough Council election
- 1979 Stevenage Borough Council election (New ward boundaries) [1]
- 1980 Stevenage Borough Council election
- 1982 Stevenage Borough Council election
- 1983 Stevenage Borough Council election
- 1984 Stevenage Borough Council election (Borough boundary changes took place but the number of seats remained the same) [2]
- 1986 Stevenage Borough Council election
- 1987 Stevenage Borough Council election (Borough boundary changes took place but the number of seats remained the same) [3]
- 1988 Stevenage Borough Council election
- 1990 Stevenage Borough Council election
- 1991 Stevenage Borough Council election
- 1992 Stevenage Borough Council election
- 1994 Stevenage Borough Council election
- 1995 Stevenage Borough Council election
- 1996 Stevenage Borough Council election
- 1998 Stevenage Borough Council election
- 1999 Stevenage Borough Council election (New ward boundaries) [4] [5]
- 2000 Stevenage Borough Council election
- 2002 Stevenage Borough Council election
- 2003 Stevenage Borough Council election
- 2004 Stevenage Borough Council election
- 2006 Stevenage Borough Council election
- 2007 Stevenage Borough Council election
- 2008 Stevenage Borough Council election
- 2010 Stevenage Borough Council election
- 2011 Stevenage Borough Council election
- 2012 Stevenage Borough Council election
- 2014 Stevenage Borough Council election
- 2015 Stevenage Borough Council election
- 2016 Stevenage Borough Council election
- 2018 Stevenage Borough Council election
- 2019 Stevenage Borough Council election
- 2021 Stevenage Borough Council election
- 2022 Stevenage Borough Council election
- 2023 Stevenage Borough Council election
- 2024 Stevenage Borough Council election (New ward boundaries) [6]
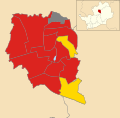
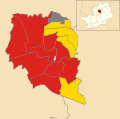
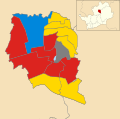
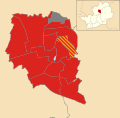
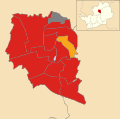
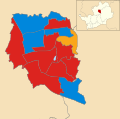
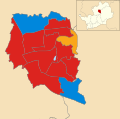
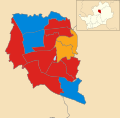
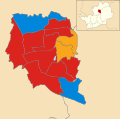
Borough result maps
-
 1979 results map
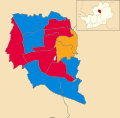
 -
 1980 results map
 -
 1982 results map
 -
 1983 results map
 -
 1984 results map
 -
 1986 results map
 -
 1987 results map
 -
1988 results map
-
1990 results map
-
 1991 results map
 -
 1992 results map
 -
 1994 results map
 -
 1995 results map
 -
 1996 results map
 -
1998 results map
-
 1999 results map
 -
2000 results map
-
2002 results map
-
2003 results map
-
 2004 results map
 -
2006 results map
-
2007 results map
-
 2008 results map
 -
2010 results map
-
2011 results map
-
2012 results map
-
2014 results map
-
 2015 results map
 -
 2016 results map
 -
 2018 results map
 -
 2019 results map
 -
 2021 results map
 -
 2022 results map
 -
 2023 results map
 -
 2024 results map


By-election results
1994-1998
| Party | Candidate | Votes | % | ±% | |
|---|---|---|---|---|---|
| Labour | 1,519 | 59.2 | -14.8 | ||
| Conservative | 596 | 23.2 | +8.1 | ||
| Liberal Democrats | 367 | 14.3 | +3.5 | ||
| Independent | 86 | 3.3 | +3.3 | ||
| Majority | 923 | 36.0 | |||
| Turnout | 2,568 | ||||
| Labour hold | Swing | ||||
| Party | Candidate | Votes | % | ±% | |
|---|---|---|---|---|---|
| Labour | 2,260 | 53.0 | -18.8 | ||
| Conservative | 1,398 | 32.8 | +4.6 | ||
| Liberal Democrats | 603 | 14.1 | +14.1 | ||
| Majority | 862 | 20.2 | |||
| Turnout | 4,261 | ||||
| Labour hold | Swing | ||||
1998-2002
| Party | Candidate | Votes | % | ±% | |
|---|---|---|---|---|---|
| Labour | 520 | 49.6 | -16.6 | ||
| Liberal Democrats | 309 | 29.5 | +16.3 | ||
| Conservative | 220 | 21.0 | +0.3 | ||
| Majority | 211 | 20.1 | |||
| Turnout | 1,049 | 26.1 | |||
| Labour hold | Swing | ||||
| Party | Candidate | Votes | % | ±% | |
|---|---|---|---|---|---|
| Labour | 495 | 73.9 | +14.2 | ||
| Conservative | 106 | 15.8 | -2.2 | ||
| Liberal Democrats | 69 | 10.3 | -7.4 | ||
| Majority | 389 | 58.1 | |||
| Turnout | 670 | 13.5 | |||
| Labour hold | Swing | ||||
2002-2006
| Party | Candidate | Votes | % | ±% | |
|---|---|---|---|---|---|
| Labour | Sherma Batson | 600 | 52.6 | +8.1 | |
| Conservative | 292 | 25.6 | -4.0 | ||
| Liberal Democrats | Gordon Knight | 249 | 21.8 | -4.0 | |
| Majority | 308 | 27.0 | |||
| Turnout | 1,141 | 25.9 | |||
| Labour hold | Swing | ||||
2006-2010
| Party | Candidate | Votes | % | ±% | |
|---|---|---|---|---|---|
| Labour | Lin Martin-Haugh | 671 | 54.8 | +3.2 | |
| Conservative | Leslie Clark | 302 | 24.7 | +1.7 | |
| Liberal Democrats | Mary Griffith | 149 | 12.2 | -0.3 | |
| UKIP | Rick Seddon | 61 | 5.0 | +5.0 | |
| Green | Tom Moore | 41 | 3.3 | +3.3 | |
| Majority | 368 | 30.1 | |||
| Turnout | 1,225 | 29.0 | |||
| Labour hold | Swing | ||||
| Party | Candidate | Votes | % | ±% | |
|---|---|---|---|---|---|
| Labour | Bruce Jackson | 716 | 54.4 | +6.9 | |
| Conservative | Ralph Dimelow | 321 | 24.4 | -5.1 | |
| Liberal Democrats | Gordon Knight | 112 | 8.5 | -2.8 | |
| UKIP | Terence Tompkins | 85 | 6.5 | +6.5 | |
| Free England Party | Richard Atkins | 81 | 6.2 | -5.4 | |
| Majority | 395 | 30.0 | |||
| Turnout | 1,315 | ||||
| Labour hold | Swing | ||||
2014-2018
| Party | Candidate | Votes | % | ±% | |
|---|---|---|---|---|---|
| Conservative | Alexander Farquharson | 725 | 44.1 | +15.5 | |
| Labour | Monika Cherney-Craw | 714 | 43.4 | +0.0 | |
| Liberal Democrats | Thomas Wren | 94 | 5.7 | +1.0 | |
| Green | Martin Malocco | 87 | 5.3 | +0.1 | |
| TUSC | Helen Kerr | 25 | 1.5 | +0.5 | |
| Majority | 11 | 0.7 | |||
| Turnout | 1,645 | ||||
| Conservative gain from Labour | Swing | ||||
2022-2026
| Party | Candidate | Votes | % | ±% | |
|---|---|---|---|---|---|
| Labour | Conor McGrath | 907 | 69.8 | +13.0 | |
| Conservative | Matthew Wyatt | 263 | 20.2 | -7.1 | |
| Liberal Democrats | Chris Berry | 129 | 9.9 | -1.6 | |
| Majority | 644 | 49.6 | |||
| Turnout | 1,299 | ||||
| Labour hold | Swing | ||||
References
- ^ The Borough of Stevenage (Electoral Arrangements) Order 1976
- ^ The East Hertfordshire and Stevenage (Areas) Order 1984
- ^ The Hertfordshire (District Boundaries) Order 1986
- ^ "Stevenage". BBC Online. Retrieved 11 May 2008.
- ^ legislation.gov.uk - The Borough of Stevenage (Electoral Changes) Order 1998. Retrieved on 4 October 2015.
- ^ McRae, Isabella (6 June 2022). "Stevenage could see new boundaries for council wards in the borough". Herts Live. Retrieved 22 March 2024.
- ^ "Pin Green Election Results - 25 September 2008". Stevenage.gov.uk. Archived from the original on 1 October 2008. Retrieved 22 October 2008.
- ^ "Local Elections Archive Project — Roebuck Ward". www.andrewteale.me.uk. Retrieved 9 June 2024.
- ^ "Local Elections Archive Project — Bedwell Ward". www.andrewteale.me.uk. Retrieved 9 June 2024.