-
 1905 representation order
 -
 1914 representation order
 -
 1924 representation order
 -
 1933 representation order
 -
 1947 representation order
 -
 1952 representation order
 -
 1966 representation order
 -
 1976 representation order
 -
 1987 representation order (as Prince Albert—Churchill River)
 -
 1996 representation order
 -
 2003 representation order
 -
 2013 representation order
 -
 2023 final report
Photos • Location

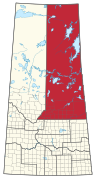
 Prince Albert in relation to other Saskatchewan federal electoral districts as of the 2013 Representation Order. | |||
| Coordinates: | 53°12′11″N 104°50′28″W / 53.203°N 104.841°W | ||
| Federal electoral district | |||
| Legislature | House of Commons | ||
| MP |
Conservative | ||
| District created | 1996 | ||
| First contested | 1997 | ||
| Last contested | 2021 | ||
| District webpage | profile, map | ||
| Demographics | |||
| Population ( 2011) [1] | 79,344 | ||
| Electors (2015) | 55,873 | ||
| Area (km²) [2] | 18,927 | ||
| Pop. density (per km²) | 4.2 | ||
| Census subdivision(s) | Prince Albert, Melfort, Nipawin, Buckland No. 491, Tisdale, Prince Albert No. 461 | ||
Prince Albert is a federal electoral district in Saskatchewan, Canada, that has been represented in the House of Commons of Canada from 1908 to 1988, and since 1997.
It is one of two districts which has been represented by two different Prime Ministers: William Lyon Mackenzie King from 1926 to 1945, and John Diefenbaker from 1953 to 1979; the district of Quebec East was the other. It is also the only district where two future Prime Ministers competed against each other – King against Diefenbaker, in the 1926 election.
Geography
This riding is found in the central part of the province, in the transitional area between the Aspen parkland and boreal forest biomes. The major centre of the riding, and its namesake, is the city of Prince Albert which has a rich political history. Smaller centres in the riding include Nipawin, Melfort, and Tisdale.
History
The electoral district was first created in 1907 from portions of Humboldt, Mackenzie, and Saskatchewan. It existed in this form until 1987 when it was abolished into Prince Albert—Churchill River, Saskatoon—Humboldt, and The Battlefords—Meadow Lake. It was re-created in 1996 from portions of the Prince Albert—Churchill River, Mackenzie, and Saskatoon—Humboldt ridings.
While the city of Prince Albert has significant NDP support, the rural areas are among the most conservative in Saskatchewan and the country.[ citation needed] As a result, it has been in the hands of a centre-right party for its entire existence in its current incarnation.
This riding lost a fraction of territory to Desnethé—Missinippi—Churchill River, and gained territory from Saskatoon—Humboldt, Desnethé—Missinippi—Churchill River and a fraction from Saskatoon—Wanuskewin during the 2012 electoral redistribution.
During the campaign for the 2021 election, Liberal candidate, Estelle Hjertaas, had several of her campaign signs vandalized. [3]
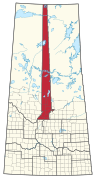
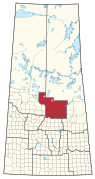
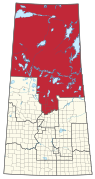
Historical boundaries


Demographics
| Panethnic group | 2021 [4] | 2016 [5] | 2011 [6] | |||||||||||
|---|---|---|---|---|---|---|---|---|---|---|---|---|---|---|
| Pop. | % | Pop. | % | Pop. | % | |||||||||
| European [a] | 46,375 | 59.66% | 49,435 | 64.1% | 52,840 | 68.98% | ||||||||
| Indigenous | 25,730 | 33.1% | 23,625 | 30.63% | 21,880 | 28.56% | ||||||||
| Southeast Asian [b] | 2,530 | 3.25% | 1,935 | 2.51% | 540 | 0.7% | ||||||||
| South Asian | 1,215 | 1.56% | 790 | 1.02% | 275 | 0.36% | ||||||||
| African | 950 | 1.22% | 655 | 0.85% | 270 | 0.35% | ||||||||
| East Asian [c] | 290 | 0.37% | 340 | 0.44% | 570 | 0.74% | ||||||||
| Latin American | 275 | 0.35% | 120 | 0.16% | 145 | 0.19% | ||||||||
| Middle Eastern [d] | 185 | 0.24% | 135 | 0.18% | 40 | 0.05% | ||||||||
| Other/ multiracial [e] | 180 | 0.23% | 100 | 0.13% | 45 | 0.06% | ||||||||
| Total responses | 77,730 | 96.15% | 77,125 | 96.86% | 76,605 | 96.55% | ||||||||
| Total population | 80,845 | 100% | 79,625 | 100% | 79,344 | 100% | ||||||||
| Notes: Totals greater than 100% due to multiple origin responses. Demographics based on 2012 Canadian federal electoral redistribution riding boundaries. | ||||||||||||||
Members of Parliament
Election results
1997–present
Graphs are unavailable due to technical issues. There is more info on
Phabricator and on
MediaWiki.org. |
Graph of election results in Prince Albert (since 1997, minor parties that never got 2% of the vote or didn't run consistently are omitted)
| 2021 Canadian federal election | ||||||||
|---|---|---|---|---|---|---|---|---|
| Party | Candidate | Votes | % | ±% | Expenditures | |||
| Conservative | Randy Hoback | 22,340 | 64.9 | -2.8 | $43,253.20 | |||
| New Democratic | Ken MacDougall | 5,214 | 15.1 | -2.3 | $5,527.17 | |||
| Liberal | Estelle Hjertaas | 3,653 | 10.6 | +0.3 | $19,152.96 | |||
| People's | Joseph McCrea | 2,388 | 6.9 | +4.9 | $3,603.87 | |||
| Maverick | Heather Schmitt | 466 | 1.4 | - | $7,787.78 | |||
| Green | Hamish Graham | 364 | 1.1 | -1.0 | $0.00 | |||
| Total valid votes/Expense limit | 34,425 | 100.0 | – | $110,268.45 | ||||
| Total rejected ballots | 161 | 0.5 | ||||||
| Turnout | 34,586 | 60.2 | ||||||
| Eligible voters | 57,483 | |||||||
| Source: Elections Canada [7] | ||||||||
| 2021 federal election redistributed results [8] | |||
|---|---|---|---|
| Party | Vote | % | |
| Conservative | 23,253 | 64.09 | |
| New Democratic | 5,448 | 15.02 | |
| Liberal | 4,284 | 11.81 | |
| People's | 2,496 | 6.88 | |
| Green | 398 | 1.10 | |
| Others | 403 | 1.11 | |
| 2019 Canadian federal election | ||||||||
|---|---|---|---|---|---|---|---|---|
| Party | Candidate | Votes | % | ±% | Expenditures | |||
| Conservative | Randy Hoback | 26,891 | 67.7 | +17.91 | $47,630.00 | |||
| New Democratic | Harmony Johnson-Harder | 6,925 | 17.4 | -11.06 | none listed | |||
| Liberal | Estelle Hjertaas | 4,107 | 10.3 | -9.52 | $32,348.20 | |||
| Green | Kerri Wall | 839 | 2.1 | +0.17 | $0.00 | |||
| People's | Kelly Day | 778 | 2.0 | - | $2,327.52 | |||
| Veterans Coalition | Brian Littlepine | 170 | 0.4 | - | none listed | |||
| Total valid votes/expense limit | 39,710 | 100.0 | ||||||
| Total rejected ballots | 237 | |||||||
| Turnout | 39,947 | 69.8 | ||||||
| Eligible voters | 57,200 | |||||||
| Conservative hold | Swing | +14.49 | ||||||
| Source: Elections Canada [9] [10] | ||||||||
| 2015 Canadian federal election | ||||||||
|---|---|---|---|---|---|---|---|---|
| Party | Candidate | Votes | % | ±% | Expenditures | |||
| Conservative | Randy Hoback | 19,673 | 49.79 | -12.63 | $150,007.16 | |||
| New Democratic | Lon Borgerson | 11,244 | 28.46 | -3.03 | $73,259.98 | |||
| Liberal | Gordon Kirkby | 7,832 | 19.82 | +16.38 | $10,644.06 | |||
| Green | Byron Tenkink | 761 | 1.93 | -0.29 | $422.40 | |||
| Total valid votes/expense limit | 39,510 | 100.0 | $210,065.49 | |||||
| Total rejected ballots | 103 | – | – | |||||
| Turnout | 39,613 | – | – | |||||
| Eligible voters | 55,873 | |||||||
| Source: Elections Canada [11] [12] | ||||||||
| 2011 federal election redistributed results [13] | |||
|---|---|---|---|
| Party | Vote | % | |
| Conservative | 20,774 | 62.42 | |
| New Democratic | 10,482 | 31.49 | |
| Liberal | 1,144 | 3.44 | |
| Green | 740 | 2.22 | |
| Others | 142 | 0.43 | |
| 2011 Canadian federal election | ||||||||
|---|---|---|---|---|---|---|---|---|
| Party | Candidate | Votes | % | ±% | Expenditures | |||
| Conservative | Randy Hoback | 19,214 | 62.2 | +4.5 | $79,394 | |||
| New Democratic | Valerie Mushinski | 9,841 | 31.8 | +3.0 | $47,100 | |||
| Liberal | Ron Wassill | 1,070 | 3.5 | -4.5 | $1,991 | |||
| Green | Myk Brazier | 666 | 2.2 | -2.7 | – | |||
| Canadian Action | Craig Batley | 116 | 0.4 | -0.2 | – | |||
| Total valid votes/expense limit | 30,907 | 100.0 | $83,468 | |||||
| Total rejected ballots | 88 | 0.3 | +0.1 | |||||
| Turnout | 30,995 | 60.8 | +5 | |||||
| Eligible voters | 50,946 | – | – | |||||
| 2008 Canadian federal election | ||||||||
|---|---|---|---|---|---|---|---|---|
| Party | Candidate | Votes | % | ±% | Expenditures | |||
| Conservative | Randy Hoback | 16,542 | 57.7 | +3.3 | $72,129 | |||
| New Democratic | Valerie Mushinski | 8,243 | 28.8 | +5.0 | $47,075 | |||
| Liberal | Lou Doderai | 2,289 | 8.0 | -11.4 | $10,138 | |||
| Green | Amanda Judith Marie Smytaniuk | 1,413 | 4.9 | +2.6 | $2,466 | |||
| Canadian Action | Craig Batley | 167 | 0.6 | – | $ | |||
| Total valid votes/expense limit | 28,654 | 100.0 | $80,865 | |||||
| Total rejected ballots | 55 | 0.2 | -0.1 | |||||
| Turnout | 28,709 | 56 | -6 | |||||
| 2006 Canadian federal election | ||||||||
|---|---|---|---|---|---|---|---|---|
| Party | Candidate | Votes | % | ±% | Expenditures | |||
| Conservative | Brian Fitzpatrick | 17,271 | 54.4 | +7.2 | $65,910 | |||
| New Democratic | Valerie Mushinski | 7,562 | 23.8 | -1.3 | $23,690 | |||
| Liberal | Patrick Jahn | 6,149 | 19.4 | -4.8 | $28,756 | |||
| Green | Marc Loiselle | 744 | 2.4 | -1.1 | $350 | |||
| Total valid votes | 31,726 | 100.0 | – | |||||
| Total rejected ballots | 85 | 0.3 | -0.1 | |||||
| Turnout | 31,811 | 61.5% | +8.0 | |||||
| 2004 Canadian federal election | ||||||||
|---|---|---|---|---|---|---|---|---|
| Party | Candidate | Votes | % | ±% | Expenditures | |||
| Conservative | Brian Fitzpatrick | 13,576 | 47.3 | -10.4 | $69,931 | |||
| New Democratic | Don Hovdebo | 7,221 | 25.1 | +4.6 | $30,743 | |||
| Liberal | Patrick Jahn | 6,929 | 24.1 | +3.4 | $42,440 | |||
| Green | Marc Loiselle | 987 | 3.4 | +2.5 | $110 | |||
| Total valid votes | 28,713 | 100.0 | – | |||||
| Total rejected ballots | 107 | 0.4 | +0.2 | |||||
| Turnout | 28,820 | 53.5 | -10.7 | |||||
Note: Conservative vote is compared to the total of the Canadian Alliance vote and Progressive Conservative vote in 2000 election.
| 2000 Canadian federal election | ||||||||
|---|---|---|---|---|---|---|---|---|
| Party | Candidate | Votes | % | ±% | Expenditures | |||
| Alliance | Brian Fitzpatrick | 14,825 | 45.6 | +7.5 | $58,048 | |||
| Liberal | Tim Longworth | 6,754 | 20.8 | -0.4 | $46,856 | |||
| New Democratic | Dennis Nowoselsky | 6,676 | 20.5 | -11.2 | $49,523 | |||
| Progressive Conservative | David Orchard | 3,943 | 12.1 | +3.9 | $63,282 | |||
| Green | Benjamin Webster | 317 | 1.0 | – | $20 | |||
| Total valid votes | 32,515 | 100.0 | – | |||||
| Total rejected ballots | 83 | 0.23 | ||||||
| Turnout | 32,598 | 64.1 | -0.4 | |||||
Note: Canadian Alliance vote is compared to the Reform vote in 1997 election.
| 1997 Canadian federal election | ||||||||
|---|---|---|---|---|---|---|---|---|
| Party | Candidate | Votes | % | ±% | Expenditures | |||
| Reform | Derrek Konrad | 12,508 | 38.1 | – | $55,562 | |||
| New Democratic | Ray Funk | 10,418 | 31.7 | – | $59,376 | |||
| Liberal | Gordon Kirkby | 6,965 | 21.2 | – | $37,643 | |||
| Progressive Conservative | Brian Fripp | 2,702 | 8.2 | – | $13,911 | |||
| Canadian Action | John Hrapchak | 275 | 0.8 | – | ||||
| Total valid votes | 32,868 | 100.0 | – | |||||
| Total rejected ballots | 107 | 0.3 | ||||||
| Turnout | 32,975 | 64.5 | ||||||
1908–1988
| 1984 Canadian federal election | ||||||||
|---|---|---|---|---|---|---|---|---|
| Party | Candidate | Votes | % | ±% | ||||
| New Democratic | Stan Hovdebo | 13,359 | 35.6 | +0.8 | ||||
| Progressive Conservative | Gordon Dobrowolsky | 13,062 | 34.8 | +2.3 | ||||
| Liberal | J.H. Clyne Harradence | 10,886 | 29.0 | -3.8 | ||||
| Confederation of Regions | Tony Panas | 262 | 0.7 | |||||
| Total valid votes | 37,569 | 100.0 | ||||||
| 1980 Canadian federal election | ||||||||
|---|---|---|---|---|---|---|---|---|
| Party | Candidate | Votes | % | ±% | ||||
| New Democratic | Stan Hovdebo | 11,601 | 34.8 | -3.2 | ||||
| Liberal | J.H. Clyne Harradence | 10,919 | 32.8 | +7.3 | ||||
| Progressive Conservative | Kris Eggum | 10,819 | 32.5 | -3.6 | ||||
| Total valid votes | 33,339 | 100.0 | ||||||
| Canadian federal by-election, 19 November 1979 | ||||||||
|---|---|---|---|---|---|---|---|---|
| Party | Candidate | Votes | % | ±% | ||||
| On Mr. Diefenbaker's death, 16 August 1979 | ||||||||
| New Democratic | Stan Hovdebo | 10,941 | 38.0 | +2.3 | ||||
| Progressive Conservative | Kris Eggum | 10,385 | 36.0 | -12.9 | ||||
| Liberal | J.H. Clyne Harradence | 7,336 | 25.5 | +10.1 | ||||
| Independent | John L. De Bruyne | 147 | 0.5 | |||||
| Total valid votes | 28,809 | 100.0 | ||||||
| 1979 Canadian federal election | ||||||||
|---|---|---|---|---|---|---|---|---|
| Party | Candidate | Votes | % | ±% | ||||
| Progressive Conservative | John Diefenbaker | 16,438 | 49.0 | -10.2 | ||||
| New Democratic | Stan Hovdebo | 11,979 | 35.7 | +14.1 | ||||
| Liberal | Peter Abrametz | 5,158 | 15.4 | -2.7 | ||||
| Total valid votes | 33,575 | 100.0 | ||||||
| 1974 Canadian federal election | ||||||||
|---|---|---|---|---|---|---|---|---|
| Party | Candidate | Votes | % | ±% | ||||
| Progressive Conservative | John Diefenbaker | 17,787 | 59.1 | -0.4 | ||||
| New Democratic | Thora E. Wiggens | 6,496 | 21.6 | -6.3 | ||||
| Liberal | Philip Edward West | 5,426 | 18.0 | +7.0 | ||||
| Social Credit | Joseph Gerrard Cools | 366 | 1.2 | -0.1 | ||||
| Total valid votes | 30,075 | 100.0 | ||||||
| 1972 Canadian federal election | ||||||||
|---|---|---|---|---|---|---|---|---|
| Party | Candidate | Votes | % | ±% | ||||
| Progressive Conservative | John Diefenbaker | 19,410 | 59.5 | +3.5 | ||||
| New Democratic | Bill Berezowsky | 9,115 | 27.9 | -0.2 | ||||
| Liberal | Leo F. Pinel | 3,613 | 11.1 | -4.7 | ||||
| Social Credit | Claude Campagna | 421 | 1.3 | |||||
| Independent | Bill Fair | 61 | 0.2 | |||||
| Total valid votes | 32,620 | 100.0 | ||||||
| 1968 Canadian federal election | ||||||||
|---|---|---|---|---|---|---|---|---|
| Party | Candidate | Votes | % | ±% | ||||
| Progressive Conservative | John Diefenbaker | 17,850 | 56.0 | -9.0 | ||||
| New Democratic | Al Hartley | 8,979 | 28.2 | +10.6 | ||||
| Liberal | Philip Edward West | 5,025 | 15.8 | +1.4 | ||||
| Total valid votes | 31,854 | 100.0 | ||||||
| 1965 Canadian federal election | ||||||||
|---|---|---|---|---|---|---|---|---|
| Party | Candidate | Votes | % | ±% | ||||
| Progressive Conservative | John Diefenbaker | 15,635 | 65.1 | -6.3 | ||||
| New Democratic | Peter Kachur | 4,227 | 17.6 | +4.1 | ||||
| Liberal | Lenore Ramsland Andrews | 3,453 | 14.4 | +1.5 | ||||
| Social Credit | John Dashchuk | 718 | 3.0 | +0.7 | ||||
| Total valid votes | 24,033 | 100.0 | ||||||
| 1963 Canadian federal election | ||||||||
|---|---|---|---|---|---|---|---|---|
| Party | Candidate | Votes | % | ±% | ||||
| Progressive Conservative | John Diefenbaker | 17,824 | 71.4 | +0.6 | ||||
| New Democratic | Henry Merrifield Apps | 3,373 | 13.5 | -2.7 | ||||
| Liberal | Harold John Fraser | 3,206 | 12.8 | +2.2 | ||||
| Social Credit | Kenneth Solheim | 565 | 2.3 | -0.2 | ||||
| Total valid votes | 24,968 | 100.0 | ||||||
| 1962 Canadian federal election | ||||||||
|---|---|---|---|---|---|---|---|---|
| Party | Candidate | Votes | % | ±% | ||||
| Progressive Conservative | John Diefenbaker | 18,276 | 70.8 | -1.3 | ||||
| New Democratic | Roger C. Carter | 4,173 | 16.2 | -0.7 | ||||
| Liberal | George William Newell | 2,745 | 10.6 | -0.4 | ||||
| Social Credit | Ken Solheim | 627 | 2.4 | |||||
| Total valid votes | 25,821 | 100.0 | ||||||
Note: NDP vote is compared to CCF vote in 1958 election.
| 1958 Canadian federal election | ||||||||
|---|---|---|---|---|---|---|---|---|
| Party | Candidate | Votes | % | ±% | ||||
| Progressive Conservative | John Diefenbaker | 16,583 | 72.1 | +19.0 | ||||
| Co-operative Commonwealth | Thora Elizabeth Wiggens | 3,870 | 16.8 | -8.1 | ||||
| Liberal | Ernie Unruh | 2,538 | 11.0 | -11.0 | ||||
| Total valid votes | 22,991 | 100.0 | ||||||
| 1957 Canadian federal election | ||||||||
|---|---|---|---|---|---|---|---|---|
| Party | Candidate | Votes | % | ±% | ||||
| Progressive Conservative | John Diefenbaker | 12,349 | 53.1 | +9.0 | ||||
| Co-operative Commonwealth | Robert Nathaniel Gooding | 5,795 | 24.9 | -6.0 | ||||
| Liberal | Russell Ernest Partridge | 5,119 | 22.0 | -1.7 | ||||
| Total valid votes | 23,263 | 100.0 | ||||||
| 1953 Canadian federal election | ||||||||
|---|---|---|---|---|---|---|---|---|
| Party | Candidate | Votes | % | ±% | ||||
| Progressive Conservative | John Diefenbaker | 10,038 | 44.1 | +31.9 | ||||
| Co-operative Commonwealth | David Frederick Corney | 7,037 | 30.9 | -8.8 | ||||
| Liberal | Floyd Robert Glass | 5,409 | 23.7 | -24.4 | ||||
| Labor–Progressive | Phyllis Clarke | 295 | 1.3 | |||||
| Total valid votes | 22,779 | 100.0 | ||||||
| 1949 Canadian federal election | ||||||||
|---|---|---|---|---|---|---|---|---|
| Party | Candidate | Votes | % | ±% | ||||
| Liberal | Francis Heselton Helme | 8,916 | 48.2 | +7.8 | ||||
| Co-operative Commonwealth | Edward LeRoy Bowerman | 7,341 | 39.6 | -1.3 | ||||
| Progressive Conservative | George Henry Whitter | 2,258 | 12.2 | -2.1 | ||||
| Total valid votes | 18,515 | 100.0 | ||||||
| 1945 Canadian federal election | ||||||||
|---|---|---|---|---|---|---|---|---|
| Party | Candidate | Votes | % | ±% | Elected | |||
| Co-operative Commonwealth | Edward LeRoy Bowerman | 7,928 | 40.99 | +30.0 | ||||
| Liberal | William Lyon Mackenzie King | 7,799 | 40.32 | −5.6 | ||||
| Progressive Conservative | Walter Hemming Nelson | 2,768 | 14.31 | |||||
| Social Credit | Joshua Norman Haldeman | 847 | 4.38 | |||||
| Total valid votes | 19,342 | 100.0 | ||||||
Source(s)
"Prince Albert, Saskatchewan (1908-09-17 - 1988-09-30)". History of Federal Ridings Since 1867. Library of Parliament. Retrieved 24 March 2020. | ||||||||
| 1940 Canadian federal election | ||||||||
|---|---|---|---|---|---|---|---|---|
| Party | Candidate | Votes | % | ±% | Elected | |||
| Liberal | William Lyon Mackenzie King | 8,310 | 45.96 | −8.7 | ||||
| National-Unity | Robert Rae Manville | 7,534 | 41.67 | |||||
| Co-operative Commonwealth | Peter William Strelive | 1,993 | 11.02 | +2.2 | ||||
| Communist | Alfred Cowie Campbell | 243 | 1.34 | |||||
| Total valid votes | 18,080 | 100.0 | ||||||
Source(s)
"Prince Albert, Saskatchewan (1908-09-17 - 1988-09-30)". History of Federal Ridings Since 1867. Library of Parliament. Retrieved 24 March 2020. | ||||||||
| 1935 Canadian federal election | ||||||||
|---|---|---|---|---|---|---|---|---|
| Party | Candidate | Votes | % | ±% | Elected | |||
| Liberal | William Lyon Mackenzie King | 9,087 | 54.67 | +1.2 | ||||
| Social Credit | Alexander Rupert Bedard | 3,185 | 19.16 | |||||
| Conservative | Tom Francis Graves | 2,880 | 17.33 | −29.2 | ||||
| Co-operative Commonwealth | Tom Johnston | 1,469 | 8.84 | |||||
| Total valid votes | 16,621 | 100.0 | ||||||
Source(s)
"Prince Albert, Saskatchewan (1908-09-17 - 1988-09-30)". History of Federal Ridings Since 1867. Library of Parliament. Retrieved 24 March 2020. | ||||||||
| 1930 Canadian federal election | ||||||||
|---|---|---|---|---|---|---|---|---|
| Party | Candidate | Votes | % | ±% | Elected | |||
| Liberal | William Lyon Mackenzie King | 9,283 | 53.43 | |||||
| Conservative | George Braden | 8,091 | 46.57 | |||||
| Total valid votes | 17,374 | 100.0 | ||||||
Source(s)
"Prince Albert, Saskatchewan (1908-09-17 - 1988-09-30)". History of Federal Ridings Since 1867. Library of Parliament. Retrieved 24 March 2020. | ||||||||
| Canadian federal by-election, November 2, 1926 On Mr. King's acceptance of an office of emolument under the Crown, October 11, 1926. | ||||||||
|---|---|---|---|---|---|---|---|---|
| Party | Candidate | Votes | Elected | |||||
| Liberal | William Lyon Mackenzie King | acclaimed | ||||||
| Total valid votes | - | - | ||||||
Source(s)
"Prince Albert, Saskatchewan (1908-09-17 - 1988-09-30)". History of Federal Ridings Since 1867. Library of Parliament. Retrieved 24 March 2020. | ||||||||
| 1926 Canadian federal election | ||||||||
|---|---|---|---|---|---|---|---|---|
| Party | Candidate | Votes | % | ±% | Elected | |||
| Liberal | William Lyon Mackenzie King | 8,933 | 64.87 | −12.6 | ||||
| Conservative | John Diefenbaker | 4,838 | 35.13 | |||||
| Total valid votes | 13,771 | 100.0 | ||||||
Source(s)
"Prince Albert, Saskatchewan (1908-09-17 - 1988-09-30)". History of Federal Ridings Since 1867. Library of Parliament. Retrieved 24 March 2020. | ||||||||
| Canadian federal by-election, February 15, 1926 Charles McDonald's resignation on January 15, 1926. | ||||||||
|---|---|---|---|---|---|---|---|---|
| Party | Candidate | Votes | % | ±% | Elected | |||
| Liberal | William Lyon Mackenzie King | 7,920 | 77.50 | +26.3 | ||||
| Independent | David Luther Burgess | 2,299 | 22.50 | |||||
| Total valid votes | 10,219 | 100.0 | ||||||
| History of Federal Ridings Since 1867 [14] | ||||||||
| 1925 Canadian federal election | ||||||||
|---|---|---|---|---|---|---|---|---|
| Party | Candidate | Votes | % | ±% | Elected | |||
| Liberal | Charles McDonald | 5,301 | 51.2 | +20.0 | ||||
| Progressive | Andrew Knox | 2,638 | 25.5 | -28.1 | ||||
| Conservative | John Diefenbaker | 2,412 | 23.3 | +7.7 | ||||
| Total valid votes | 10,351 | 100.0 | ||||||
Source(s)
"Prince Albert, Saskatchewan (1908-09-17 - 1988-09-30)". History of Federal Ridings Since 1867. Library of Parliament. Retrieved 5 October 2021. | ||||||||
| 1921 Canadian federal election | ||||||||
|---|---|---|---|---|---|---|---|---|
| Party | Candidate | Votes | % | ±% | ||||
| Progressive | Andrew Knox | 8,525 | 53.6 | |||||
| Liberal | Lorenzo William Brigham | 4,962 | 31.2 | -0.1 | ||||
| Conservative | David Wilson Paul | 2,417 | 15.2 | -56.5 | ||||
| Total valid votes | 15,904 | 100.0 | ||||||
Note: Conservative vote is compared to Unionist vote in 1917 election.
| 1917 Canadian federal election | ||||||||
|---|---|---|---|---|---|---|---|---|
| Party | Candidate | Votes | % | ±% | ||||
| Government (Unionist) | Andrew Knox | 6,589 | 68.7 | +15.9 | ||||
| Opposition (Laurier Liberals) | Samuel McLeod | 2,999 | 31.3 | -15.9 | ||||
| Total valid votes | 9,588 | 100.0 | ||||||
Note: Unionist vote is compared to Liberal-Conservative vote in 1911 election.
| By-election on 1 February 1915
On Mr. McKay being appointed Judge, 16 December 1914 | |||||
| Party | Candidate | Votes | |||
|---|---|---|---|---|---|
| Conservative | Samuel James Donaldson | acclaimed | |||
| 1911 Canadian federal election | ||||||||
|---|---|---|---|---|---|---|---|---|
| Party | Candidate | Votes | % | ±% | ||||
| Conservative | James McKay | 3,316 | 52.8 | +6.1 | ||||
| Liberal | William Winfield Rutan | 2,961 | 47.2 | -4.2 | ||||
| Total valid votes | 6,277 | 100.0 | ||||||
| 1908 Canadian federal election | ||||||||
|---|---|---|---|---|---|---|---|---|
| Party | Candidate | Votes | % | |||||
| Liberal | William Winfield Rutan | 2,413 | 51.4 | |||||
| Conservative | James McKay | 2,194 | 46.7 | |||||
| Independent Liberal | W.H. Joseph Jaxon | 87 | 1.9 | |||||
| Total valid votes | 4,694 | 100.0 | ||||||
See also
References
- "Prince Albert (federal electoral district) (Code 47006) Census Profile". 2011 census. Government of Canada - Statistics Canada. Retrieved 3 March 2011.
Notes
- ^ Statistic includes all persons that did not make up part of a visible minority or an indigenous identity.
- ^ Statistic includes total responses of "Filipino" and "Southeast Asian" under visible minority section on census.
- ^ Statistic includes total responses of "Chinese", "Korean", and "Japanese" under visible minority section on census.
- ^ Statistic includes total responses of "West Asian" and "Arab" under visible minority section on census.
- ^ Statistic includes total responses of "Visible minority, n.i.e." and "Multiple visible minorities" under visible minority section on census.
- ^ Statistics Canada: 2012
- ^ Statistics Canada: 2012
- ^ "Prince Albert Liberal candidate frustrated with theft and vandalism of signs". CTV News. 14 September 2021. Retrieved 16 September 2021.
- ^ Government of Canada, Statistics Canada (26 October 2022). "Census Profile, 2021 Census of Population". www12.statcan.gc.ca. Retrieved 15 October 2023.
- ^ Government of Canada, Statistics Canada (27 October 2021). "Census Profile, 2016 Census". www12.statcan.gc.ca. Retrieved 15 October 2023.
- ^ Government of Canada, Statistics Canada (27 November 2015). "NHS Profile". www12.statcan.gc.ca. Retrieved 15 October 2023.
- ^ "Election Results – September 20, 2021 Federal Election". Elections Canada. Retrieved 5 October 2021.
- ^ "Transposition of Votes from the 44th General Election to the 2023 Representation Orders". Elections Canada. Retrieved 9 April 2024.
- ^ "List of confirmed candidates". Elections Canada. Retrieved 4 October 2019.
- ^ "Election Night Results". Elections Canada. Retrieved 9 November 2019.
- ^ Elections Canada – Confirmed candidates for Prince Albert, 30 September 2015
- ^ Elections Canada – Final Candidates Election Expenses Limits
- ^ Pundits' Guide to Canadian Elections
- ^ "Prince Albert, Saskatchewan (1908-09-17 – 1988-09-30)". History of Federal Ridings Since 1867. Library of Parliament. Retrieved 24 March 2020.