Photos • Location

Mühlenbecker Land | |
|---|---|
 Church in Zühlsdorf quarter | |
 Coat of arms | |
Location of Mühlenbecker Land within Oberhavel district 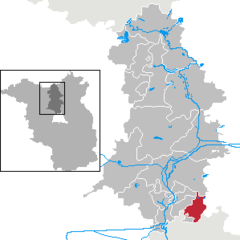 | |
 Mühlenbecker Land  Mühlenbecker Land | |
| Coordinates: 52°38′N 13°23′E / 52.633°N 13.383°E | |
| Country | Germany |
| State | Brandenburg |
| District | Oberhavel |
| Subdivisions | 4 districts |
| Government | |
| • Mayor (2019–27) | Filippo Smaldino [1] ( SPD) |
| Area | |
| • Total | 52.35 km2 (20.21 sq mi) |
| Elevation | 50 m (160 ft) |
| Population (2022-12-31)
[2] | |
| • Total | 15,573 |
| • Density | 300/km2 (770/sq mi) |
| Time zone | UTC+01:00 ( CET) |
| • Summer ( DST) | UTC+02:00 ( CEST) |
| Postal codes | 16567 |
| Dialling codes | 033056 |
| Vehicle registration | OHV |
| Website | www.muehlenbeckerland.de |
Mühlenbecker Land is a municipality in the Oberhavel district, in Brandenburg, Germany.
History
The municipality shared its borders partly with the former West Berlin, and so during the period 1961-1990 it was separated from it by the Berlin Wall.
The municipality of Mühlenbecker Land was founded on October 26, 2003 by merging the districts of Mühlenbeck, Schildow, Schönfließ and Zühlsdorf.
-
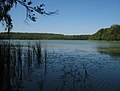 Lake "Mühlenbecker See"
 -


Traffic
Road
In Mühlenbeck there is exit 34 of the Bundesautobahn 10. As the B 96a and the L21.
Berliner S-Bahn
The stations Mühlenbeck-Mönchmühle and Schönfließ
Demography
-
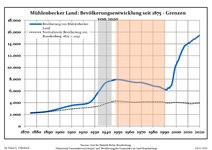 Development of population since 1875 within the current Boundaries (Blue Line: Population; Dotted Line: Comparison to Population development in Brandenburg state; Grey Background: Time of Nazi Germany; Red Background: Time of communist East Germany)
 -
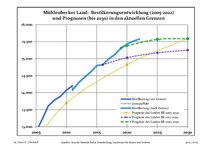 Recent Population Development and Projections (Population Development before Census 2011 (blue line); Recent Population Development according to the Census in Germany in 2011 (blue bordered line); Official projections for 2005-2030 (yellow line); for 2020-2030 (green line); for 2017-2030 (scarlet line)
|
|
|
References
- ^ Landkreis Oberhavel Wahl der Bürgermeisterin / des Bürgermeisters, accessed 2 July 2021.
- ^ "Bevölkerungsentwicklung und Bevölkerungsstandim Land Brandenburg Dezember 2022" (PDF). Amt für Statistik Berlin-Brandenburg (in German). June 2023.
- ^ Detailed data sources are to be found in the Wikimedia Commons. Population Projection Brandenburg at Wikimedia Commons
Towns and municipalities in
Oberhavel | ||
|---|---|---|
 | ||
| International | |
|---|---|
| National | |
|
| This Brandenburg location article is a stub. You can help Wikipedia by expanding it. |