Photos • Location
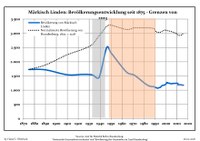
Development of population since 1875 within the current boundaries (Blue line: Population; Dotted line: Comparison to population development of Brandenburg state; Grey background: Time of Nazi rule; Red background: Time of communist rule)

Märkisch Linden | |
|---|---|
 Gottberg church | |
Location of Märkisch Linden within Ostprignitz-Ruppin district 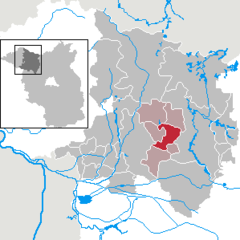 | |
 Märkisch Linden  Märkisch Linden | |
| Coordinates: 52°55′00″N 12°41′59″E / 52.91667°N 12.69972°E | |
| Country | Germany |
| State | Brandenburg |
| District | Ostprignitz-Ruppin |
| Municipal assoc. | Temnitz |
| Government | |
| • Mayor (2024–29) | Jana Schmidt [1] |
| Area | |
| • Total | 43.92 km2 (16.96 sq mi) |
| Elevation | 44 m (144 ft) |
| Population (2022-12-31)
[2] | |
| • Total | 1,269 |
| • Density | 29/km2 (75/sq mi) |
| Time zone | UTC+01:00 ( CET) |
| • Summer ( DST) | UTC+02:00 ( CEST) |
| Postal codes | 16818 |
| Dialling codes | 033920 |
| Vehicle registration | OPR |
Märkisch Linden is a municipality in the Ostprignitz-Ruppin district, in Brandenburg, Germany.
History
From 1815 to 1945, Märkisch Linden was part of the Prussian Province of Brandenburg. From 1952 to 1990, it was part of the Bezirk Potsdam of East Germany.
Demography
|
|
References
- ^ Landkreis Ostprignitz-Ruppin Wahl der Bürgermeisterin / des Bürgermeisters. Retrieved 10 July 2024.
- ^ "Bevölkerungsentwicklung und Bevölkerungsstandim Land Brandenburg Dezember 2022" (PDF). Amt für Statistik Berlin-Brandenburg (in German). June 2023.
- ^ Detailed data sources are to be found in the Wikimedia Commons. Population Projection Brandenburg at Wikimedia Commons
Towns and municipalities in
Ostprignitz-Ruppin | ||
|---|---|---|
 | ||
|
| This Brandenburg location article is a stub. You can help Wikipedia by expanding it. |