
Size of this preview:
451 × 599 pixels. Other resolutions:
181 × 240 pixels |
361 × 480 pixels |
703 × 934 pixels.
Original file (703 × 934 pixels, file size: 28 KB, MIME type: image/png)
| This is a file from the
Wikimedia Commons. Information from its
description page there is shown below. Commons is a freely licensed media file repository. You can help. |
.png)
Summary
| Description |
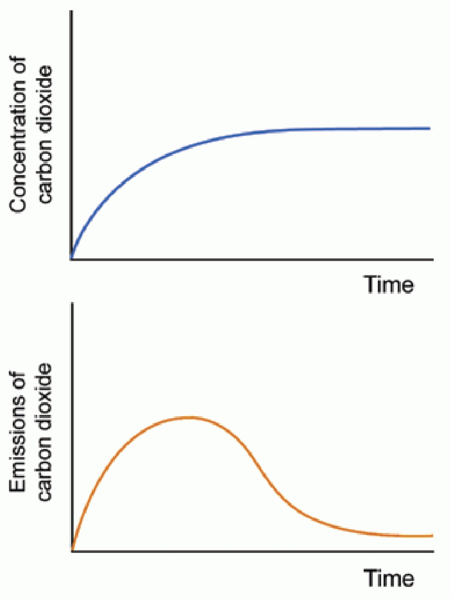
English: The image shows how stabilizing the
atmospheric concentration of
carbon dioxide at a constant level would require carbon dioxide emissions to be effectively eliminated. The graph on the bottom shows a substantial reduction in carbon dioxide emissions from their present level over time. Carbon dioxide emissions peak then decline to a fraction of their current level. The graph on the top shows how this reduction would lead to the atmospheric concentration of carbon dioxide being stabilized at a constant level. |
| Date | |
| Source | The image is taken from the report, "Synthesis and Assessment Product 5.2: Best practice approaches for characterizing, communicating, and incorporating scientific uncertainty in decisionmaking," page 11. This report is freely available and can be downloaded from http://www.ipcc-wg2.gov/njlite_download.php?id=5805 ( archived version) |
| Author | U.S. Climate Change Science Program and the Subcommittee on Global Change Research (Granger Morgan, H. Dowlatabadi, M. Henrion, D. Keith, R. Lempert, S. McBride, M. Small, T. Wilbanks (eds.)). National Oceanic and Atmospheric Administration, Washington D.C., USA. |
| Permission ( Reusing this file) |
http://www.ngdc.noaa.gov/ngdcinfo/privacy.html en:National Geophysical Data Center |
| Other versions | File:Stabilizing the atmospheric concentration of carbon dioxide at a constant level would require emissions to be effectively eliminated.png |
| This is a
retouched picture, which means that it has been digitally altered from its original version. Modifications: Changed graph placement from horizontal to vertical.
|
Licensing
This image is in the
public domain because it contains materials that originally came from the U.S.
National Oceanic and Atmospheric Administration, taken or made as part of an employee's official duties.
|

|
File:Stabilizing the atmospheric concentration of carbon dioxide at a constant level would require emissions to be effectively eliminated (vertical) 1.svg is a vector version of this file. It should be used in place of this PNG file when not inferior.
File:Stabilizing the atmospheric concentration of carbon dioxide at a constant level would require emissions to be effectively eliminated (vertical).png →
File:Stabilizing the atmospheric concentration of carbon dioxide at a constant level would require emissions to be effectively eliminated (vertical) 1.svg
For more information, see
Help:SVG. |
_1.svg) |
File history
Click on a date/time to view the file as it appeared at that time.
| Date/Time | Thumbnail | Dimensions | User | Comment | |
|---|---|---|---|---|---|
| current | 18:11, 18 September 2011 |
| 703 × 934 (28 KB) | Enescot | {{Information |Description ={{en|1=The image shows how stabilizing the atmospheric concentration of carbon dioxide at a constant level would require carbon dioxide emissions to be effectively eliminated. The graph on the bottom shows a substantial redu |
File usage
The following pages on the English Wikipedia use this file (pages on other projects are not listed):
Global file usage
The following other wikis use this file:
- Usage on az.wikipedia.org
- Usage on cs.wikipedia.org
- Usage on es.wikipedia.org
- Usage on id.wikipedia.org
- Usage on uk.wikipedia.org
.png)