
Size of this preview:
800 × 331 pixels. Other resolutions:
320 × 132 pixels |
640 × 265 pixels |
1,024 × 423 pixels |
1,280 × 529 pixels |
4,387 × 1,814 pixels.
Original file (4,387 × 1,814 pixels, file size: 1.97 MB, MIME type: image/jpeg)
| This is a file from the
Wikimedia Commons. Information from its
description page there is shown below. Commons is a freely licensed media file repository. You can help. |
Summary
| Description |
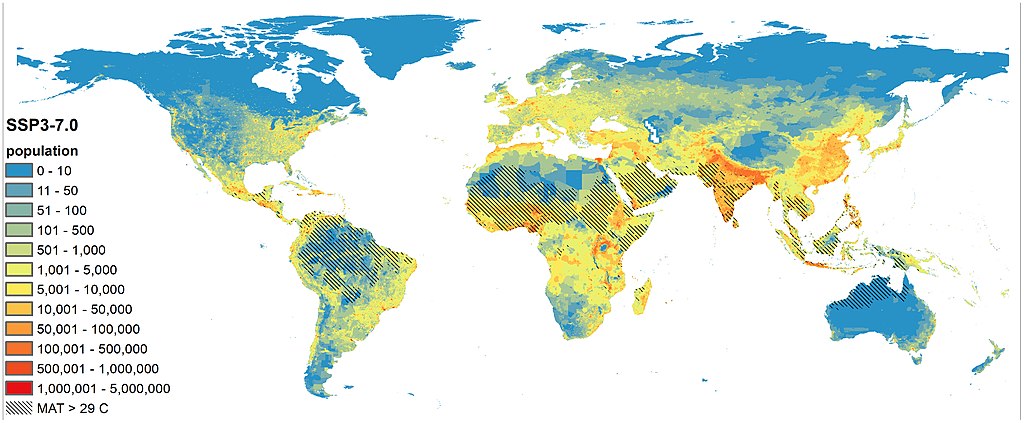
English: "Overlap between future population distribution and extreme heat. CMIP6 model data [from nine GCM models available from the WorldClim database (45)] were used to calculate MAT under SSP3-7.0 during around 2070 (2060–2080) alongside Shared SSP3 demographic projections to ∼2070 (46). The shaded areas depict regions where MAT exceeds 29 °C, while the colored topography details the spread of population density." |
| Date | |
| Source | https://www.pnas.org/doi/full/10.1073/pnas.2108146119 |
| Author | Authors of the study: Luke Kemp, Chi Xu, Joanna Depledge, Kristie L. Ebi, Goodwin Gibbins, Timothy A. Kohler, Johan Rockström, Marten Scheffer, Hans Joachim Schellnhuber, Will Steffen, and Timothy M. Lenton (and edited by Kerry Emanuel) |
Licensing
This file is licensed under the
Creative Commons
Attribution 4.0 International license.
- You are free:
- to share – to copy, distribute and transmit the work
- to remix – to adapt the work
- Under the following conditions:
- attribution – You must give appropriate credit, provide a link to the license, and indicate if changes were made. You may do so in any reasonable manner, but not in any way that suggests the licensor endorses you or your use.
File history
Click on a date/time to view the file as it appeared at that time.
| Date/Time | Thumbnail | Dimensions | User | Comment | |
|---|---|---|---|---|---|
| current | 22:10, 16 September 2022 |
| 4,387 × 1,814 (1.97 MB) | Prototyperspective | Uploaded a work by Authors of the study: Luke Kemp, Chi Xu, Joanna Depledge, Kristie L. Ebi, Goodwin Gibbins, Timothy A. Kohler, Johan Rockström, Marten Scheffer, Hans Joachim Schellnhuber, Will Steffen, and Timothy M. Lenton (and edited by Kerry Emanuel) from https://www.pnas.org/doi/full/10.1073/pnas.2108146119 with UploadWizard |
File usage
The following pages on the English Wikipedia use this file (pages on other projects are not listed):
Global file usage
The following other wikis use this file:
- Usage on bn.wikipedia.org
- Usage on hy.wikipedia.org
- Usage on ig.wikipedia.org