
Size of this PNG preview of this SVG file:
600 × 450 pixels. Other resolutions:
320 × 240 pixels |
640 × 480 pixels |
1,024 × 768 pixels |
1,280 × 960 pixels |
2,560 × 1,920 pixels.
Original file (SVG file, nominally 600 × 450 pixels, file size: 204 KB)
| This is a file from the
Wikimedia Commons. Information from its
description page there is shown below. Commons is a freely licensed media file repository. You can help. |
| Description |
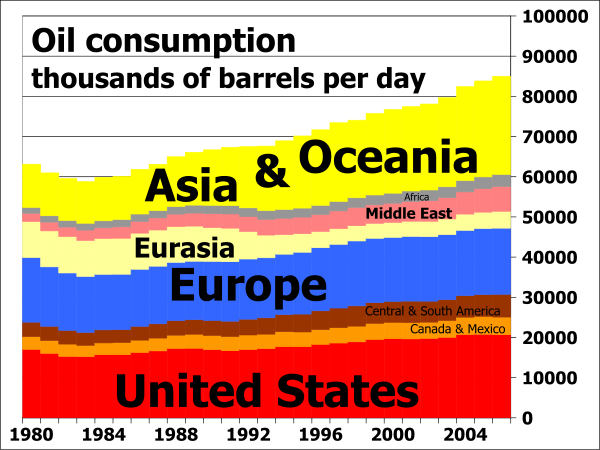
English: Oil consumption in daily barrels per region from 1980 to 2006; vertical extents indicate barrels of oil consumed per day, and the horizontal scale shows years from 1980 to 2007. |
| Date | |
| Source |
I, 84user, created this work using the excel file RecentPetroleumConsumptionBarrelsperDay.xls from the U.S. Energy Information Administration's web page
http://tonto.eia.doe.gov/dnav/pet/pet_pri_wco_k_w.htm (direct link:
http://www.eia.doe.gov/emeu/international/RecentPetroleumConsumptionBarrelsperDay.xls) and using Open Source Gnumeric 1.9.1 to produce the chart. See also  |
| Author | 84user |
| Permission ( Reusing this file) |
PD-SELF; Released into the public domain (by the author). |
| Other versions |
 |
See also


Licensing
| This work has been released into the
public domain by its author,
84user. This applies worldwide. In some countries this may not be legally possible; if so: |
File history
Click on a date/time to view the file as it appeared at that time.
| Date/Time | Thumbnail | Dimensions | User | Comment | |
|---|---|---|---|---|---|
| current | 14:52, 25 October 2008 |
| 600 × 450 (204 KB) | 84user | increased main title font size |
| 14:31, 25 October 2008 |
 | 600 × 450 (195 KB) | 84user | {{Information |Description={{en|Oil consumption in daily barrels per region from 1980 to 2006; vertical extents indicate barrels of oil consumed per day, and the horizontal scale shows years from 1980 to 2007.}} |Source=I, 84user, created this work using |
File usage
The following pages on the English Wikipedia use this file (pages on other projects are not listed):
Global file usage
The following other wikis use this file:
- Usage on es.wikipedia.org
- Usage on fa.wikipedia.org
- Usage on id.wikipedia.org
- Usage on ko.wikipedia.org
- Usage on th.wikipedia.org
- Usage on ur.wikipedia.org