
Size of this PNG preview of this SVG file:
800 × 343 pixels. Other resolutions:
320 × 137 pixels |
640 × 274 pixels |
1,024 × 439 pixels |
1,280 × 549 pixels |
2,560 × 1,097 pixels |
1,344 × 576 pixels.
Original file (SVG file, nominally 1,344 × 576 pixels, file size: 13 KB)
| This is a file from the
Wikimedia Commons. Information from its
description page there is shown below. Commons is a freely licensed media file repository. You can help. |
Summary
| Description |
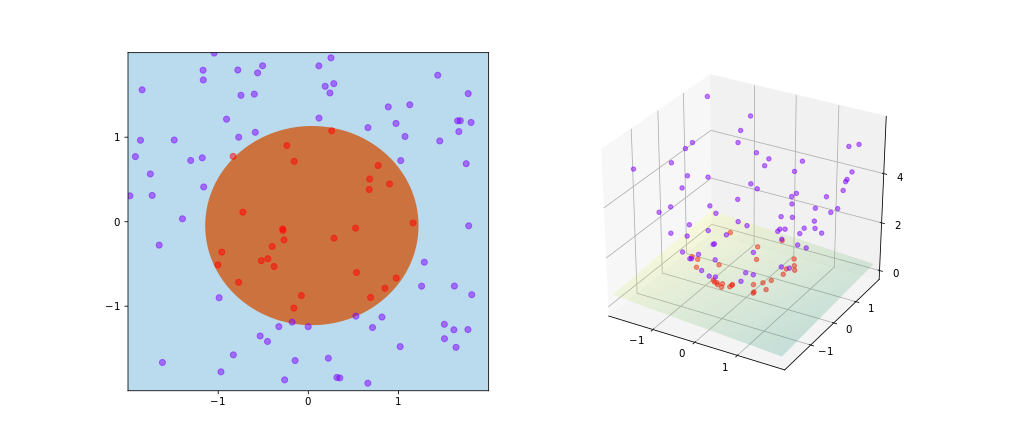
English: An illustration of kernel trick in SVM. Here the kernel is given by:
|
| Date | |
| Source | Own work |
| Author | Shiyu Ji |


Python Source Code
import numpy as np
import matplotlib
matplotlib.use('svg')
import matplotlib.pyplot as plt
from sklearn import svm
from matplotlib import cm

# Prepare the training set.
# Suppose there is a circle with center at (0, 0) and radius 1.2.
# All the points within the circle are labeled 1.
# All the points outside the circle are labeled 0.
nSamples = 100
spanLen = 2
X = np.zeros((nSamples, 2))
y = np.zeros((nSamples, ))

for i in range(nSamples):
  a, b = np.random.uniform(-spanLen, spanLen) for _ in 'x', 'y']]
  Xi][0], Xi][1 = a, b
  yi = 1 if a*a + b*b < 1.2*1.2 else 0

# Custom kernel,
def my_kernel(A, B):
  gram = np.zeros((A.shape0], B.shape0]))
  for i in range(A.shape0]):
    for j in range(B.shape0]):
      assert A.shape1 == B.shape1
      L2A, L2B = 0.0, 0.0
      for k in range(A.shape1]):
        grami, j += Ai, k * Bj, k
        L2A += Ai, k * Ai, k
        L2B += Bj, k * Bj, k
      grami, j += L2A * L2B
  return gram

# SVM train.
clf = svm.SVC(kernel = my_kernel)
clf.fit(X, y)
coef = clf.dual_coef_0
sup = clf.support_
b = clf.intercept_
x_min, x_max = -spanLen, spanLen
y_min, y_max = -spanLen, spanLen
xx, yy = np.meshgrid(np.arange(x_min, x_max, .02), np.arange(y_min, y_max, .02))
Z = clf.predict(np.c_xx.ravel(), yy.ravel()])
Z = Z.reshape(xx.shape)

# Plot the 2D layout.
fig = plt.figure(figsize = (6, 14))
plt1 = plt.subplot(121)
plt1.set_xlim([-spanLen, spanLen])
plt1.set_ylim([-spanLen, spanLen])
plt1.set_xticks([-1, 0, 1])
plt1.set_yticks([-1, 0, 1])
plt1.pcolormesh(xx, yy, Z, cmap=cm.Paired)
y_unique = np.unique(y)
colors = cm.rainbow(np.linspace(0.0, 1.0, y_unique.size))
for this_y, color in zip(y_unique, colors):
  this_Xx = Xi][0 for i in range(len(X)) if yi == this_y
  this_Xy = Xi][1 for i in range(len(X)) if yi == this_y
  plt1.scatter(this_Xx, this_Xy, c=color, alpha=0.5)

# Process the training data into 3D by applying the kernel mapping:
# phi(x, y) = (x, y, x*x + y*y).
X3d = np.ndarray((X.shape0], 3))
for i in range(X.shape0]):
    a, b = Xi][0], Xi][1
    X3di, 0], X3di, 1], X3di, 2 = a, b, a*a + b*b

# Plot the 3D layout after applying the kernel mapping.
from mpl_toolkits.mplot3d import Axes3D
plt2 = plt.subplot(122, projection="3d")
plt2.set_xlim([-spanLen, spanLen])
plt2.set_ylim([-spanLen, spanLen])
plt2.set_xticks([-1, 0, 1])
plt2.set_yticks([-1, 0, 1])
plt2.set_zticks([0, 2, 4])
for this_y, color in zip(y_unique, colors):
  this_Xx = X3di, 0 for i in range(len(X3d)) if yi == this_y
  this_Xy = X3di, 1 for i in range(len(X3d)) if yi == this_y
  this_Xz = X3di, 2 for i in range(len(X3d)) if yi == this_y
  plt2.scatter(this_Xx, this_Xy, this_Xz, c=color, alpha=0.5)

# Plot the 3D boundary.
def onBoundary(x, y, z, X3d, coef, sup, b):
  err = 0.0
  n = len(coef)
  for i in range(n):
    err += coefi * (x*X3dsupi], 0 + y*X3dsupi], 1 + z*X3dsupi], 2])
  err += b
  if abs(err) < .1:
    return True
  return False

Xr = np.arange(x_min, x_max, .02)
Yr = np.arange(y_min, y_max, .02)
Z = np.zeros(Z.shape)
for i in range(Xr.shape0]):
  x = Xri
  for j in range(Yr.shape0]):
    y = Yrj
    for z in np.arange(0, 2, .02):
      if onBoundary(x, y, z, X3d, coef, sup, b):
        Zi, j = z
        break
plt2.plot_surface(xx, yy, Z, cmap='summer', alpha=0.2)

plt.savefig("kernel_trick_idea.svg", format = "svg")
Licensing
I, the copyright holder of this work, hereby publish it under the following license:
This file is licensed under the
Creative Commons
Attribution-Share Alike 4.0 International license.
- You are free:
- to share – to copy, distribute and transmit the work
- to remix – to adapt the work
- Under the following conditions:
- attribution – You must give appropriate credit, provide a link to the license, and indicate if changes were made. You may do so in any reasonable manner, but not in any way that suggests the licensor endorses you or your use.
- share alike – If you remix, transform, or build upon the material, you must distribute your contributions under the same or compatible license as the original.
File history
Click on a date/time to view the file as it appeared at that time.
| Date/Time | Thumbnail | Dimensions | User | Comment | |
|---|---|---|---|---|---|
| current | 14:41, 17 July 2020 |
| 1,344 × 576 (13 KB) | SemperVinco | Optimized svg code |
| 06:08, 28 June 2017 |
 | 1,260 × 540 (8.06 MB) | Shiyu Ji | Reverted to version as of 05:28, 28 June 2017 (UTC) | |
| 06:05, 28 June 2017 |
 | 540 × 1,260 (7.33 MB) | Shiyu Ji | vertical for better display | |
| 05:28, 28 June 2017 |
 | 1,260 × 540 (8.06 MB) | Shiyu Ji | User created page with UploadWizard |
File usage
The following pages on the English Wikipedia use this file (pages on other projects are not listed):
Global file usage
The following other wikis use this file:
- Usage on ca.wikipedia.org
- Usage on de.wikipedia.org
- Usage on es.wikipedia.org
- Usage on fa.wikipedia.org
- Usage on fr.wikipedia.org
- Usage on it.wikipedia.org
- Usage on ja.wikipedia.org
- Usage on ru.wikipedia.org
- Usage on sr.wikipedia.org
- Usage on uk.wikipedia.org
- Usage on zh.wikipedia.org