Size of this preview:
778 × 599 pixels. Other resolutions:
312 × 240 pixels |
623 × 480 pixels |
997 × 768 pixels |
1,280 × 986 pixels |
2,560 × 1,972 pixels |
4,332 × 3,337 pixels.
Original file (4,332 × 3,337 pixels, file size: 26.91 MB, MIME type: image/jpeg)
| This is a file from the
Wikimedia Commons. Information from its
description page there is shown below. Commons is a freely licensed media file repository. You can help. |
Summary
| Description |
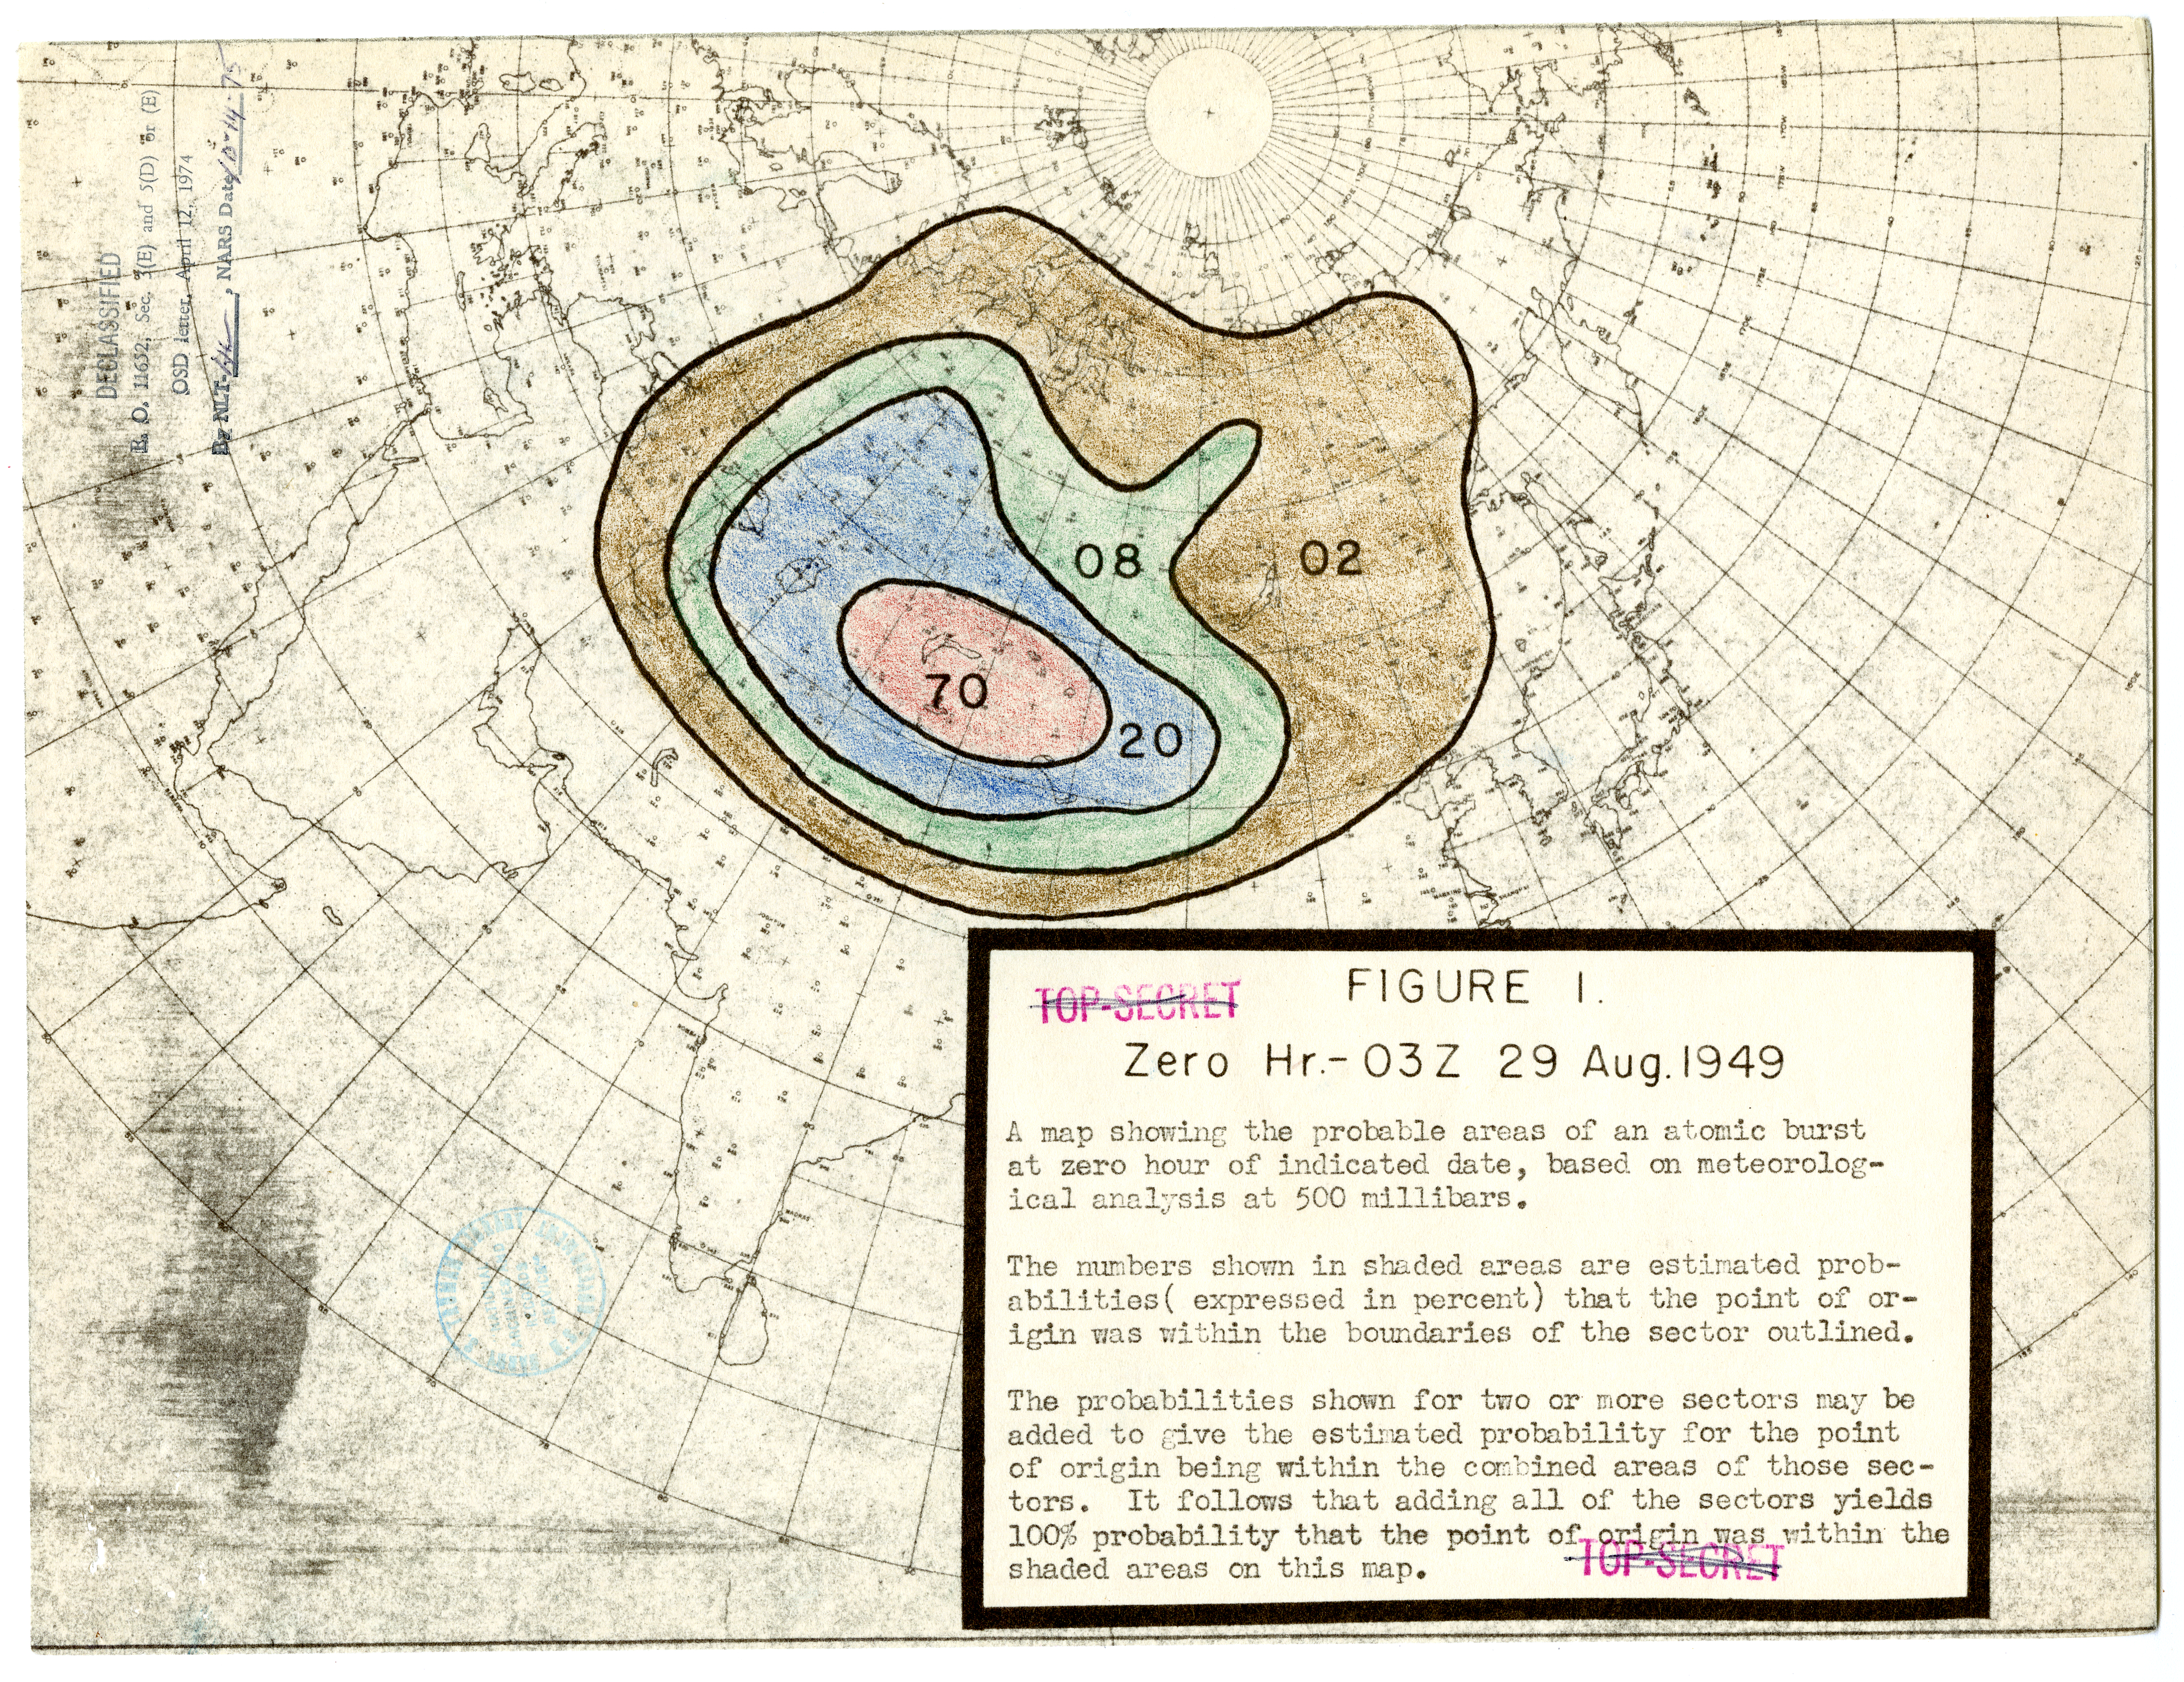
English: This chart from September 1949 shows the United States Weather Bureau's prediction for where the Soviet Union first tested its atomic bomb in 1949. Each colored zone indicates the probability that the bomb was detonated within that area. This is one of several maps, each one showing slightly different probabilities depending on the exact date the bomb was assumed to have gone off (this one uses the date now known to be correct). The analysis was done by extrapolating backwards from assumed wind patterns. |
| Date | |
| Source | US National Archives website: Harry S. Truman Presidential Library, Collection HST-PSF: President's Secretary's Files (Truman Administration), Series: Subject Files, File Unit: National Security Council - Atomic File, 1945-1952: Atomic Bomb: Reports: "Report, United States Weather Bureau Report on Alert Number 112 of the Atomic Detection System." |
| Author | United States Weather Bureau |
Licensing
This work is in the
public domain in the United States because it is a
work prepared by an officer or employee of the United States Government as part of that person’s official duties under the terms of
Title 17, Chapter 1, Section 105 of the
US Code.
Note: This only applies to original works of the Federal Government and not to the work of any individual
U.S. state,
territory, commonwealth, county, municipality, or any other subdivision. This template also does not apply to postage stamp designs published by the
United States Postal Service
since 1978. (See §
313.6(C)(1) of Compendium of U.S. Copyright Office Practices). It also does not apply to certain US coins; see
The US Mint Terms of Use.
|
 | |
| This file has been identified as being free of known restrictions under copyright law, including all related and neighboring rights. | ||
File history
Click on a date/time to view the file as it appeared at that time.
| Date/Time | Thumbnail | Dimensions | User | Comment | |
|---|---|---|---|---|---|
| current | 02:37, 4 April 2024 |
| 4,332 × 3,337 (26.91 MB) | NuclearSecrets | Uploaded a work by United States Weather Bureau from [https://catalog.archives.gov/id/310987319?objectPage=7 US National Archives website]: Harry S. Truman Presidential Library, Collection HST-PSF: President's Secretary's Files (Truman Administration), Series: Subject Files, File Unit: National Security Council - Atomic File, 1945-1952: Atomic Bomb: Reports: "Report, United States Weather Bureau Report on Alert Number 112 of the Atomic Detection System." with UploadWizard |
File usage
The following pages on the English Wikipedia use this file (pages on other projects are not listed):