No higher resolution available.
Greaterboston2.png (500 × 500 pixels, file size: 68 KB, MIME type: image/png)
| This is a file from the
Wikimedia Commons. Information from its
description page there is shown below. Commons is a freely licensed media file repository. You can help. |
Summary
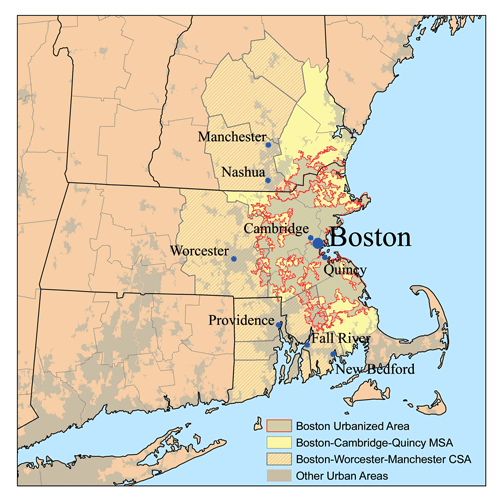
| Description | This is a map of the Greater Boston Metro area I made using U.S. Census Bureau data as of 2006. The light gray shading indicates urbanized areas with Greater Boston as defined by urbanized areas outlined in red. The Metropolitan Statistical Area is shown in yellow. The Combined Statistical Area includes the MSA plus those counties that are partially shaded. The Providence metro area was added to the Boston CSA in 2005. |
| Date | 10 January 2007 (original upload date) |
| Source | No machine-readable source provided. Own work assumed (based on copyright claims). |
| Author | No machine-readable author provided. Kmusser assumed (based on copyright claims). |
Licensing
I, the copyright holder of this work, hereby publish it under the following license:
This file is licensed under the
Creative Commons
Attribution-Share Alike 2.5 Generic license.
- You are free:
- to share – to copy, distribute and transmit the work
- to remix – to adapt the work
- Under the following conditions:
- attribution – You must give appropriate credit, provide a link to the license, and indicate if changes were made. You may do so in any reasonable manner, but not in any way that suggests the licensor endorses you or your use.
- share alike – If you remix, transform, or build upon the material, you must distribute your contributions under the same or compatible license as the original.
File history
Click on a date/time to view the file as it appeared at that time.
| Date/Time | Thumbnail | Dimensions | User | Comment | |
|---|---|---|---|---|---|
| current | 22:14, 16 January 2007 |
| 500 × 500 (68 KB) | Kmusser | increased contrast |
| 17:22, 10 January 2007 |
 | 500 × 500 (64 KB) | Kmusser | == Summary == This is a map of the Greater Boston Metro area I made using U.S. Census Bureau data as of 2006. The light gray shading indicates urbanized areas with Greater Boston as defined by urb |
File usage
The following pages on the English Wikipedia use this file (pages on other projects are not listed):
Global file usage
The following other wikis use this file:
- Usage on ar.wikipedia.org
- Usage on ast.wikipedia.org
- Usage on azb.wikipedia.org
- Usage on ca.wikipedia.org
- Usage on de.wikipedia.org
- Usage on eo.wikipedia.org
- Usage on es.wikipedia.org
- Usage on fa.wikipedia.org
- Usage on fr.wikipedia.org
- Usage on gl.wikipedia.org
- Usage on it.wikivoyage.org
- Usage on ko.wikipedia.org
- Usage on pl.wikipedia.org
- Usage on ru.wikipedia.org
- Usage on simple.wikipedia.org
- Usage on sv.wikipedia.org
- Usage on ta.wikipedia.org
- Usage on uk.wikipedia.org
- Usage on ur.wikipedia.org
- Usage on vi.wikipedia.org
- Usage on www.wikidata.org
- Usage on zh.wikipedia.org