
Size of this preview:
800 × 370 pixels. Other resolutions:
320 × 148 pixels |
640 × 296 pixels |
1,024 × 474 pixels |
1,280 × 592 pixels |
2,560 × 1,184 pixels |
5,081 × 2,350 pixels.
Original file (5,081 × 2,350 pixels, file size: 2.32 MB, MIME type: image/png)
| Description |
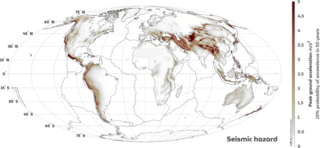
Seismic hazard maps presenting the level of certain ground motions that have a 10% chance of exceedance (or a 90% chance of non-exceedance) during a 50-year time span (corresponding to a return period of 475 years). The seismic hazard data shown from Giardini et al. (2003) describes the peak ground acceleration. The Scientific colour map ‘bilbao‘ [1] is used to represent data accurately and to all readers. | ||
|---|---|---|---|
| Source |
s-ink.org online science graphics collection · Source site: https://s-ink.org/seismic-hazard | ||
| Date |
15.12.2021 | ||
| Author |
Fabio Crameri | ||
| Permission ( Reusing this file) |
| ||
| Additional information | Figure is colour-blind friendly and the data based on Giardini et al. (2003) [2] |
- ^ Crameri, F. (2018), Scientific colour maps: Perceptually uniform and colour-blind friendly, doi: 10.5281/zenodo.1243862
- ^ Giardini, D., Grünthal, G., Shedlock, K. M. and Zhang, P.: The GSHAP Global Seismic Hazard Map. In: Lee, W., Kanamori, H., Jennings, P. and Kisslinger, C. (eds.): International Handbook of Earthquake & Engineering Seismology, International Geophysics Series 81 B, Academic Press, Amsterdam, 1233-1239, 2003.
File history
Click on a date/time to view the file as it appeared at that time.
| Date/Time | Thumbnail | Dimensions | User | Comment | |
|---|---|---|---|---|---|
| current | 13:49, 22 February 2023 |
| 5,081 × 2,350 (2.32 MB) | OneTwoThreeHoneyBee ( talk | contribs) | {{Information | description = Seismic hazard maps presenting the level of certain ground motions that have a 10% chance of exceedance (or a 90% chance of non-exceedance) during a 50-year time span (corresponding to a return period of 475 years). The seismic hazard data shown from Giardini et al. (2003) describes the peak ground acceleration. The Scientific colour map ‘bilbao‘<ref>Crameri, F. (2018), Scientific colour maps: Perceptually uniform and colour-blind friendly, doi: 10.5281/zenodo.12... |
You cannot overwrite this file.
File usage
The following pages on the English Wikipedia use this file (pages on other projects are not listed):