Size of this preview:
635 × 599 pixels. Other resolutions:
254 × 240 pixels |
509 × 480 pixels |
814 × 768 pixels |
1,085 × 1,024 pixels |
2,171 × 2,048 pixels |
4,121 × 3,888 pixels.
Original file (4,121 × 3,888 pixels, file size: 2.08 MB, MIME type: image/jpeg)
| This is a file from the
Wikimedia Commons. Information from its
description page there is shown below. Commons is a freely licensed media file repository. You can help. |
Summary
| Description |
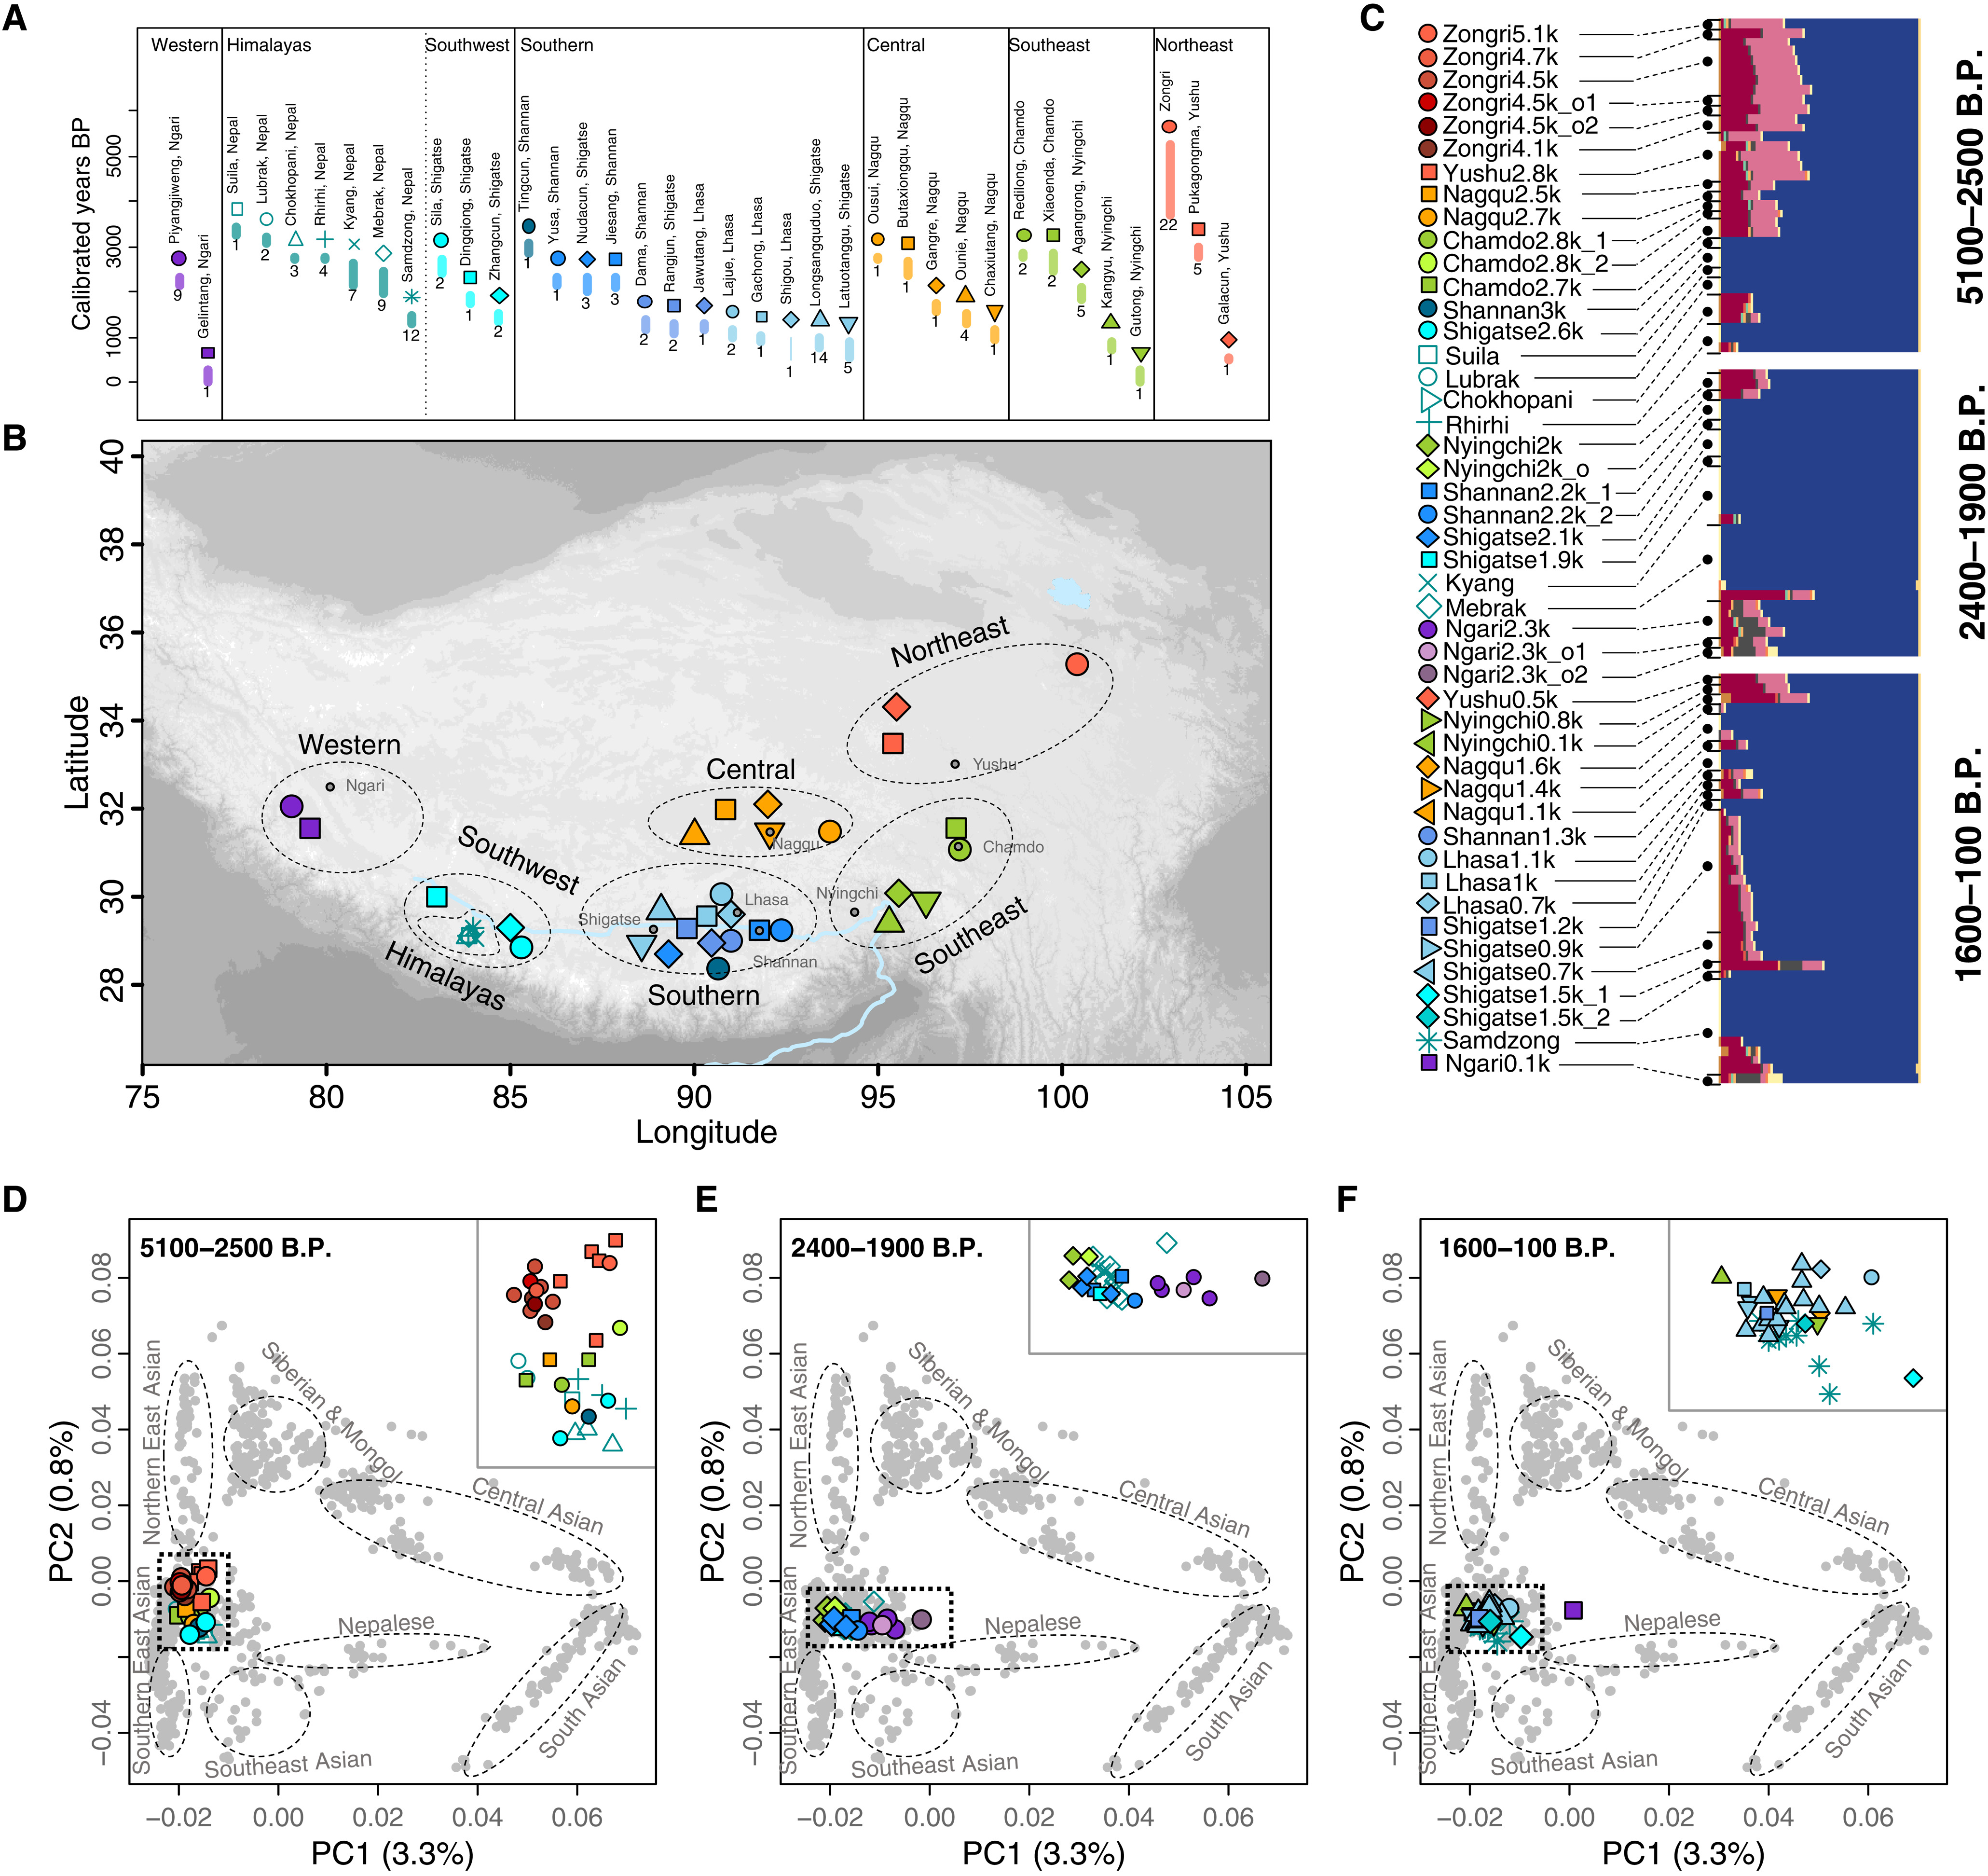
English: Chronological, geographic distribution and genetic landscape of ancient individuals of the Tibetan Plateau:
(A) Dating and number of individuals sampled per site. Thick lines show the 95% confidence interval (CI) for radiocarbon dating for all samples at a site, and thin lines denote dates estimated from archaeological contexts. Asterisks denote previously published individuals. Colors indicate the seven regions of the Tibetan Plateau in which each site is grouped, as well as denoted on the map. (B) Geographic location of each site, with the seven regions given by the dashed circles and color. Gray dots denote the capitols of the associated prefectures on the Tibetan Plateau, written in gray. (C) ADMIXTURE plot for ancient Tibetans at K = 11. Blue, Tibetan ancestry; red, southern East Asian ancestry; pink, Ancient Northern Siberian ancestry; yellow/gray, Central Asian ancestry. Full ADMIXTURE results can be found in fig. S14. (D to F) PCA of present-day populations on or near the Tibetan Plateau (gray dots) onto which ancient individuals were projected. The insets represent the black dotted square, and they zoom in on the distribution of ancient Tibetan individuals. Dashed circles indicate the broader categories into which present-day populations can be placed, labeled in gray. The corresponding present-day populations associated with these categories can be found in fig. S12. |
| Date | |
| Source | https://www.science.org/doi/10.1126/sciadv.add5582 |
| Author | HONGRU WANG, MELINDA A. YANG, SHARGAN WANGDUE, HONGLIANG LU, HONGHAI CHEN, LINHUI LI, GUANGHUI DONG, TINLEY TSRING, HAIBING YUAN, WEI HE, MANYU DING, XIAOHONG WU, SHUAI LI, NORBU TASHI, TSHO YANG, FENG YANG, YAN TONG, ZUJUN CHEN, YUANHONG HE, PENG CAO, QINGYAN DAI, FENG LIU, XIAOTIAN FENG, TIANYI WANG, RUOWEI YANG, WANJING PING, ZHAOXIA ZHANG, YANG GAO, MING ZHANG, XIAOJI WANG, CHAO ZHANG, KAI YUAN, ALBERT MIN-SHAN KO, MARK ALDENDERFER, XING GAO, SHUHUA XU, AND QIAOMEI FU |
Licensing
This file is licensed under the
Creative Commons
Attribution-Share Alike 4.0 International license.
- You are free:
- to share – to copy, distribute and transmit the work
- to remix – to adapt the work
- Under the following conditions:
- attribution – You must give appropriate credit, provide a link to the license, and indicate if changes were made. You may do so in any reasonable manner, but not in any way that suggests the licensor endorses you or your use.
- share alike – If you remix, transform, or build upon the material, you must distribute your contributions under the same or compatible license as the original.
File history
Click on a date/time to view the file as it appeared at that time.
| Date/Time | Thumbnail | Dimensions | User | Comment | |
|---|---|---|---|---|---|
| current | 17:29, 10 December 2023 |
| 4,121 × 3,888 (2.08 MB) | Wikiuser1314 | Uploaded a work by HONGRU WANG, MELINDA A. YANG, SHARGAN WANGDUE, HONGLIANG LU, HONGHAI CHEN, LINHUI LI, GUANGHUI DONG, TINLEY TSRING, HAIBING YUAN, WEI HE, MANYU DING, XIAOHONG WU, SHUAI LI, NORBU TASHI, TSHO YANG, FENG YANG, YAN TONG, ZUJUN CHEN, YUANHONG HE, PENG CAO, QINGYAN DAI, FENG LIU, XIAOTIAN FENG, TIANYI WANG, RUOWEI YANG, WANJING PING, ZHAOXIA ZHANG, YANG GAO, MING ZHANG, XIAOJI WANG, CHAO ZHANG, KAI YUAN, ALBERT MIN-SHAN KO, MARK ALDENDERFER, XING GAO, SHUHUA XU, AND QIAOMEI FU... |
File usage
The following pages on the English Wikipedia use this file (pages on other projects are not listed):