Original file (979 × 598 pixels, file size: 4 KB, MIME type: image/png)
| This is a file from the
Wikimedia Commons. Information from its
description page there is shown below. Commons is a freely licensed media file repository. You can help. |
Summary
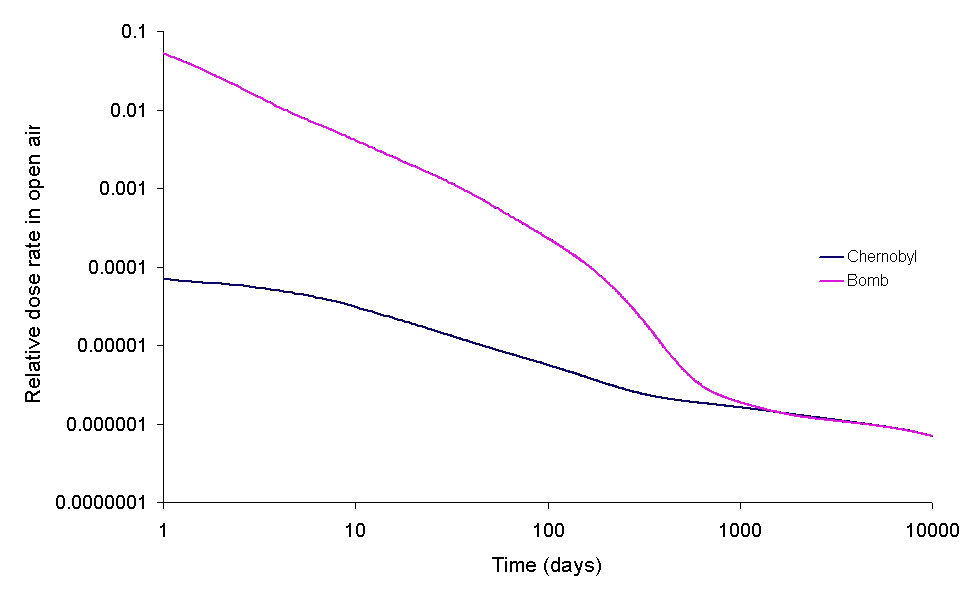
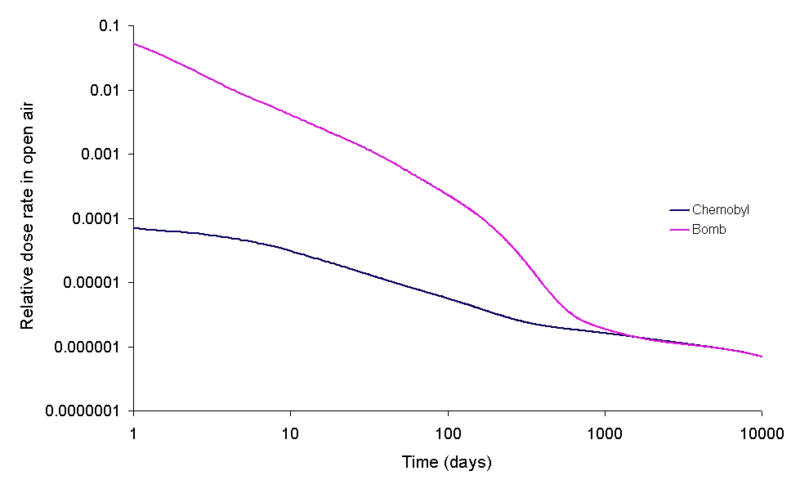
This is a graph drawn using data calculated using a method similar to that of T. Imanaka, S. Fukutani, M. Yamamoto, A. Sakaguchi and M. Hoshi, J. Radiation Research, 2006, 47, Suppl A121-A127 for calculating the dose due to the bomb fall out which calculated for a surface burst with no separation of the different isotopes. 131I, 133I, 132Te, 133I, 135I, 140Ba, 95Zr, 97Zr, 99Mo, 99mTc, 103Ru, 105Ru, 106Ru, 142La, 143Ce, 137Cs, 91Y, 91Sr, 92Sr, 128Sb and 129Sb are the gamma emitters which have been conisdered for the bomb fallout. The fission was assumed to have been caused by 1 MeV neutrons and 20% occurred in the 238U tamper of the bomb, the dose does not include the effect of any shielding. The data was from the Korean table of the isotopes.
For the chernobyl fallout
The contributions made by the different isotopes to the dose (in air) caused in the contaminated area in the time shortly after the accident. Note that this image was drawn using data from the OECD report, the Korean table of the isotopes and the second edition of 'The radiochemical manual'.
Data on the release was taken from the following two sources. It was assumed that the whole release occurred on the first day in an instant.
A short report on the release of radioisotopes from the site is on the OSTI web site [1]. A more detailed report can be downloaded from the OECD web site's public library [2] as a 1.85MB PDF file.
- ↑ Chernobyl source term, atmospheric dispersion, and dose estimation, EnergyCitationsDatabase, November 1, 1989
- ↑ OECD Papers Volume 3 Issue 1 dead link, OECD, 2003
| Description |
English: See the graphs on the trinity glass in J. Environmental Radioactivity |
||
| Date | |||
| Source | w:Image:Bombvschernobyldoserateinopenair.jpg | ||
| Author | wikipedia:en:user:Cadmium | ||
| Permission ( Reusing this file) |
|
||
| Other versions | w:Image:Bombvschernobyldoserateinopenair.jpg |
File history
Click on a date/time to view the file as it appeared at that time.
| Date/Time | Thumbnail | Dimensions | User | Comment | |
|---|---|---|---|---|---|
| current | 17:05, 26 October 2006 |
| 979 × 598 (4 KB) | Helix84 | == Summary == This is a graph drawn using data calculated using a method similar to that of T. Imanaka, S. Fukutani, M. Yamamoto, A. Sakaguchi and M. Hoshi, ''J. Radiation Research'', 2006, '''47''', Suppl A121-A127 for calculating the dose due to the bom |
File usage
Global file usage
The following other wikis use this file:
- Usage on es.wikipedia.org
- Usage on fa.wikipedia.org
- Usage on fr.wikipedia.org