
Size of this preview:
800 × 468 pixels. Other resolutions:
320 × 187 pixels |
640 × 375 pixels |
1,024 × 599 pixels |
1,280 × 749 pixels |
2,560 × 1,499 pixels |
3,577 × 2,094 pixels.
Original file (3,577 × 2,094 pixels, file size: 856 KB, MIME type: image/jpeg)
| This is a file from the
Wikimedia Commons. Information from its
description page there is shown below. Commons is a freely licensed media file repository. You can help. |
Summary
| Description |
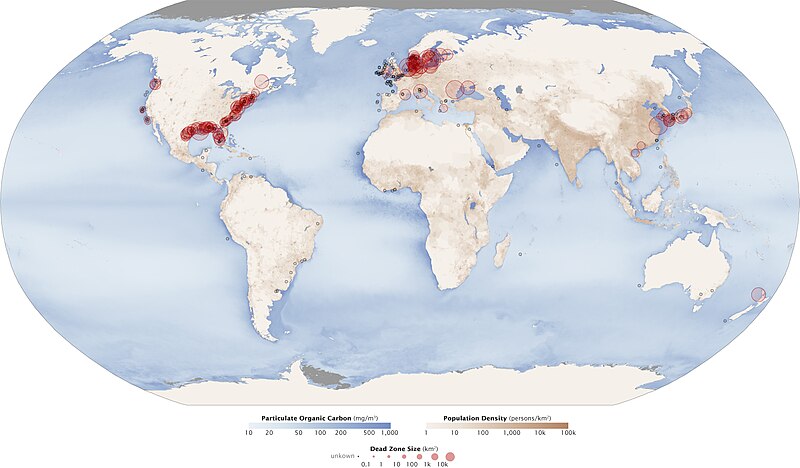
English:
Red
circles on this map show the location and size of many of
our planet’s
dead zones.
Black dots show where dead zones have been observed, but their size is unknown. It’s no coincidence that dead zones occur downriver of places where
human population
density is high (darkest
brown). Darker
blues in this image show higher concentrations of particulate organic matter, an indication of the overly fertile waters that can culminate in dead zones. |
| Date | |
| Source | NASA Earth Observatory |
| Author | Robert Simmon & Jesse Allen |
Data from Robert Diaz, Virginia Institute of Marine Science (dead zones); the GSFC Ocean Color team (particulate organic carbon); and the Socioeconomic Data and Applications Center (SEDAC) (population density).
Licensing
| This file is in the public domain in the United States because it was solely created by NASA. NASA copyright policy states that "NASA material is not protected by copyright unless noted". (See Template:PD-USGov, NASA copyright policy page or JPL Image Use Policy.) | ||
 |
Warnings:
|
File history
Click on a date/time to view the file as it appeared at that time.
| Date/Time | Thumbnail | Dimensions | User | Comment | |
|---|---|---|---|---|---|
| current | 12:17, 19 July 2010 |
| 3,577 × 2,094 (856 KB) | Originalwana | {{Information |Description={{en|1= Red circles on this map show the location and size of many of our planet’s dead zones. Black dots show where dead zones have been observed, but their size is unknown. It’s no coincidence that dea |
File usage
The following pages on the English Wikipedia use this file (pages on other projects are not listed):
Global file usage
The following other wikis use this file:
- Usage on ar.wikipedia.org
- Usage on bs.wikipedia.org
- Usage on cs.wikipedia.org
- Usage on da.wikipedia.org
- Usage on de.wikipedia.org
- Usage on en.wikibooks.org
- Usage on es.wikipedia.org
- Usage on fa.wikipedia.org
- Usage on fr.wikipedia.org
- Usage on it.wikipedia.org
- Usage on ja.wikipedia.org
- Usage on ml.wikipedia.org
- Usage on pl.wikipedia.org
- Usage on pt.wikipedia.org
- Usage on ru.wikipedia.org
- Usage on simple.wikipedia.org
- Usage on tr.wikipedia.org
- Usage on uk.wikipedia.org
- Usage on zh.wikipedia.org