
Size of this PNG preview of this TIF file:
800 × 409 pixels. Other resolutions:
320 × 164 pixels |
640 × 328 pixels |
1,024 × 524 pixels |
1,280 × 655 pixels |
2,560 × 1,310 pixels |
4,082 × 2,089 pixels.
Original file (4,082 × 2,089 pixels, file size: 289 KB, MIME type: image/tiff)
| This is a file from the
Wikimedia Commons. Information from its
description page there is shown below. Commons is a freely licensed media file repository. You can help. |
Summary
| Description |
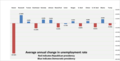
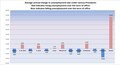
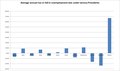
English: This is a chart of the annual rate of increase or decrease of the unemployment rate by President. The calculations are made from the end of the first year in office to the end of the last year in office (e.g. for George Bush, from Dec. 31 2001 - Dec. 31 2009), as is standard.
The reasons for the dates being chosen in this way is that the budget for the entire year and many policies for a good part of the first year in office are set by the previous administration. Data for 1945-present is taken from the Bureau of Labor Statistics Labor Force Statistics from the Current Population Survey. Data previous to 1945 is taken from McElvaine's The Great Depression, Three Rivers Press (2009), Chapter 4 |
| Date | |
| Source | Excel graph |
| Author | Hgilbert |
Licensing
I, the copyright holder of this work, hereby publish it under the following licenses:

|
Permission is granted to copy, distribute and/or modify this document under the terms of the GNU Free Documentation License, Version 1.2 or any later version published by the Free Software Foundation; with no Invariant Sections, no Front-Cover Texts, and no Back-Cover Texts. A copy of the license is included in the section entitled GNU Free Documentation License. |
This file is licensed under the
Creative Commons
Attribution-Share Alike 3.0 Unported license.
- You are free:
- to share – to copy, distribute and transmit the work
- to remix – to adapt the work
- Under the following conditions:
- attribution – You must give appropriate credit, provide a link to the license, and indicate if changes were made. You may do so in any reasonable manner, but not in any way that suggests the licensor endorses you or your use.
- share alike – If you remix, transform, or build upon the material, you must distribute your contributions under the same or compatible license as the original.
You may select the license of your choice.
| Annotations | This image is annotated: View the annotations at Commons |
File history
Click on a date/time to view the file as it appeared at that time.
| Date/Time | Thumbnail | Dimensions | User | Comment | |
|---|---|---|---|---|---|
| current | 22:12, 18 January 2024 |
 | 4,082 × 2,089 (289 KB) | The RedBurn | Reagan -> in red |
| 16:09, 24 November 2023 |
 | 4,082 × 2,089 (704 KB) | Clean Copy | Updated to end of Trump presidency | |
| 14:07, 11 August 2018 |
 | 1,205 × 649, 3 pages (2.47 MB) | Clean Copy | Updated to end-of-2017 data | |
| 13:59, 7 July 2014 |
 | 1,127 × 668 (615 KB) | Clean Copy | Fix Truman data point (he took office 1 year into term) | |
| 04:50, 7 July 2014 |
 | 1,127 × 668 (275 KB) | Clean Copy | Improved calculations and format | |
| 20:33, 5 July 2014 |
 | 1,127 × 668 (213 KB) | Clean Copy | {{subst:Upload marker added by en.wp UW}} {{Information |Description = {{en|This is a chart of the annual rate of increase or decrease of the unemployment rate by President. The calculations are made from the end of the first year in office to the end... |
File usage
The following pages on the English Wikipedia use this file (pages on other projects are not listed):