
Size of this PNG preview of this SVG file:
800 × 450 pixels. Other resolutions:
320 × 180 pixels |
640 × 360 pixels |
1,024 × 576 pixels |
1,280 × 720 pixels |
2,560 × 1,440 pixels |
1,600 × 900 pixels.
Original file (SVG file, nominally 1,600 × 900 pixels, file size: 2 KB)
| This is a file from the
Wikimedia Commons. Information from its
description page there is shown below. Commons is a freely licensed media file repository. You can help. |
Summary
| Description |
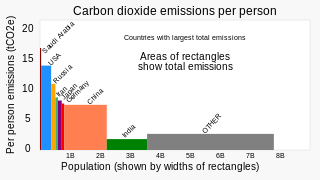
English: Chart showing per capita greenhouse gas emissions (or CO2 emissions, depending on the version), by country, for countries with the most total emissions, with the area of each column showing total emissions (includes column for "Other")
|
||
| Date | |||
| Source | Own work | ||
| Author | RCraig09 | ||
| Other versions |
|
.svg)

.svg)
.svg)
Licensing
I, the copyright holder of this work, hereby publish it under the following license:
This file is licensed under the
Creative Commons
Attribution-Share Alike 4.0 International license.
- You are free:
- to share – to copy, distribute and transmit the work
- to remix – to adapt the work
- Under the following conditions:
- attribution – You must give appropriate credit, provide a link to the license, and indicate if changes were made. You may do so in any reasonable manner, but not in any way that suggests the licensor endorses you or your use.
- share alike – If you remix, transform, or build upon the material, you must distribute your contributions under the same or compatible license as the original.
File history
Click on a date/time to view the file as it appeared at that time.
| Date/Time | Thumbnail | Dimensions | User | Comment | |
|---|---|---|---|---|---|
| current | 19:00, 16 October 2023 |
| 1,600 × 900 (2 KB) | RCraig09 | Version 4: explain horizontal axis (populations are shown by widths of rectangles) |
| 06:10, 16 August 2023 |
 | 1,600 × 900 (2 KB) | RCraig09 | Version 3: removing "tspan" element from vertical axis label to work around ongoing SVG text rendering problems on Wikimedia | |
| 03:31, 1 January 2022 |
 | 1,600 × 900 (2 KB) | RCraig09 | Version 2: update to include data for 2020 . . . . This version focuses on CO2 only (not on all greenhouse gases) . . . a more-current dataset of all greenhouse gases may be a better replacement . . . . See File:20210626 Variwide chart of greenhouse gas emissions per capita by country.svg for a 15-country CO2 chart with 2020 | |
| 16:05, 6 July 2021 |
 | 1,600 × 900 (2 KB) | RCraig09 | Uploaded own work with UploadWizard |
File usage
The following pages on the English Wikipedia use this file (pages on other projects are not listed):
- 2021 in the environment
- Climate change in China
- Climate change in India
- Climate change in Japan
- Climate change in the United States
- Climate justice
- Climate policy of China
- Energy in Iran
- Greenhouse gas emissions
- Greenhouse gas emissions by China
- Greenhouse gas emissions by Russia
- Greenhouse gas emissions by the United States
- Talk:Climate change denial/Archive 33
- Talk:Climate change in the United States/Archive 1
- User:Alexsachini/sandbox
- Wikipedia:Graphics Lab/Illustration workshop/Archive/Jun 2021
Global file usage
The following other wikis use this file:
- Usage on ja.wikipedia.org
- Usage on mk.wikipedia.org
- Usage on pt.wikipedia.org
- Usage on zh.wikipedia.org
.svg)