
Size of this preview:
800 × 545 pixels. Other resolutions:
320 × 218 pixels |
640 × 436 pixels |
1,024 × 698 pixels |
1,280 × 873 pixels |
1,889 × 1,288 pixels.
Original file (1,889 × 1,288 pixels, file size: 61 KB, MIME type: image/png)
| This is a file from the
Wikimedia Commons. Information from its
description page there is shown below. Commons is a freely licensed media file repository. You can help. |
Summary
| Description |
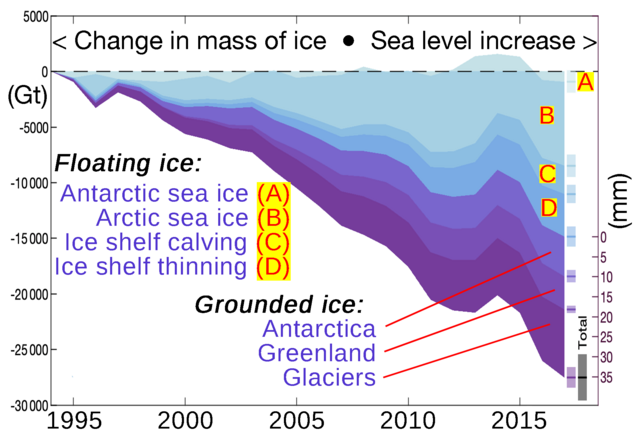
English: Graph of mass of floating ice (sea ice and calving and ice shelf thinning) and grounded ice (Antarctica, Greenland, glaciers), also indicating resultant sea level rise on second vertical axis.
|
| Date | |
| Source | https://tc.copernicus.org/articles/15/233/2021/ |
| Author | Thomas Slater, Isobel R. Lawrence, Inès N. Otosaka, Andrew Shepherd, Noel Gourmelen, Livia Jakob, Paul Tepes, Lin Gilbert, and Peter Nienow |
| Other versions |
|
_and_grounded_(purples)_components.png)
Related file
-
 1994- Earth's ice imbalance - ice loss - Climate change - Global warming.svg —
image based on data from the Slater et al. source

Licensing
This file is licensed under the
Creative Commons
Attribution-Share Alike 4.0 International license.
- You are free:
- to share – to copy, distribute and transmit the work
- to remix – to adapt the work
- Under the following conditions:
- attribution – You must give appropriate credit, provide a link to the license, and indicate if changes were made. You may do so in any reasonable manner, but not in any way that suggests the licensor endorses you or your use.
- share alike – If you remix, transform, or build upon the material, you must distribute your contributions under the same or compatible license as the original.
File history
Click on a date/time to view the file as it appeared at that time.
| Date/Time | Thumbnail | Dimensions | User | Comment | |
|---|---|---|---|---|---|
| current | 19:36, 1 June 2024 |
| 1,889 × 1,288 (61 KB) | RCraig09 | Version 3: enhance legends per request at Talk:Sea level rise at en.WP |
| 05:41, 14 April 2021 |
 | 1,889 × 1,288 (96 KB) | RCraig09 | Version 2: reduced file size at tinypng.com | |
| 21:32, 26 January 2021 |
 | 1,889 × 1,288 (269 KB) | RCraig09 | Uploaded a work by Thomas Slater, Isobel R. Lawrence, Inès N. Otosaka, Andrew Shepherd, Noel Gourmelen, Livia Jakob, Paul Tepes, Lin Gilbert, and Peter Nienow from https://tc.copernicus.org/articles/15/233/2021/ with UploadWizard |
File usage
The following pages on the English Wikipedia use this file (pages on other projects are not listed):
Global file usage
The following other wikis use this file:
- Usage on bn.wikipedia.org
- Usage on el.wikipedia.org
- Usage on es.wikipedia.org
- Usage on eu.wikipedia.org
- Usage on he.wikipedia.org
- Usage on ig.wikipedia.org
- Usage on mk.wikipedia.org
- Usage on pt.wikipedia.org
- Usage on zh.wikipedia.org