
Original file (9,606 × 5,725 pixels, file size: 775 KB, MIME type: image/png)
| This is a file from the
Wikimedia Commons. Information from its
description page there is shown below. Commons is a freely licensed media file repository. You can help. |

|
This graph image could be re-created using
vector graphics as an
SVG file. This has several advantages; see
Commons:Media for cleanup for more information. If an SVG form of this image is available, please upload it and afterwards replace this template with
{{
vector version available|new image name}}
.
It is recommended to name the SVG file “1 AD to 2003 AD Historical Trends in global distribution of GDP China India Western Europe USA Middle East.svg”—then the template Vector version available (or Vva) does not need the new image name parameter. |
Summary
| Description |
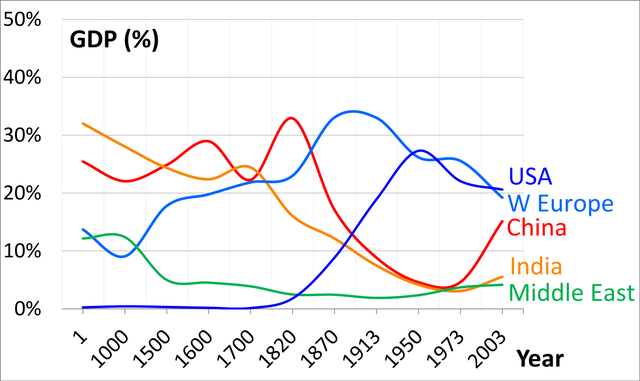
English: This map shows the evolution of global economies over 2000 years, in terms of percent GDP contribution by each major economy over history. The chart plots the data from the published tables of Angus Maddison, the British Economist.
The %GDP of Western Europe in the chart is the region in Europe that includes the following modern countries - UK, France, Germany, Italy, Belgium, Switzerland, Denmark, Finland, Sweden, Norway, Netherlands, Portugal, Spain and other smaller states in the Western part of Europe. The %GDP of Middle East in the chart is the region in West Asia and Northeast Africa that includes the following modern countries - Egypt, Israel, Palestinian Territories, Lebanon, Syria, Turkey, Jordan, Saudi Arabia, Qatar, Bahrain, Kuwait, UAE, Oman, Yemen, Iran, Iraq and other regions in the Arabian region. Data Source: Maddison A (2007), Contours of the World Economy I-2030AD, Oxford University Press, ISBN 978-0199227204 The data can be downloaded in spreadsheet format here. The data can also be viewed in a different graph here, as prepared by Ken Henry (Secretary to the Treasury, Australian Government, 18 May 2010). |
| Date | |
| Source | Own work |
| Author | M Tracy Hunter |
Licensing
- You are free:
- to share – to copy, distribute and transmit the work
- to remix – to adapt the work
- Under the following conditions:
- attribution – You must give appropriate credit, provide a link to the license, and indicate if changes were made. You may do so in any reasonable manner, but not in any way that suggests the licensor endorses you or your use.
- share alike – If you remix, transform, or build upon the material, you must distribute your contributions under the same or compatible license as the original.
File history
Click on a date/time to view the file as it appeared at that time.
| Date/Time | Thumbnail | Dimensions | User | Comment | |
|---|---|---|---|---|---|
| current | 16:58, 19 July 2014 |
| 9,606 × 5,725 (775 KB) | M Tracy Hunter | User created page with UploadWizard |
File usage
Global file usage
The following other wikis use this file:
- Usage on az.wikipedia.org
- Usage on bg.wikipedia.org
- Usage on de.wikipedia.org
- Usage on es.wikipedia.org
- Usage on fi.wikipedia.org
- Usage on he.wikipedia.org
- Usage on hi.wikipedia.org
- Usage on hy.wikipedia.org
- Usage on ja.wikipedia.org
- Usage on mk.wikipedia.org
- Usage on tr.wikipedia.org
- Usage on uk.wikipedia.org
- Usage on uz.wikipedia.org
- Usage on vi.wikipedia.org
- Usage on www.wikidata.org
- Usage on zh.wikipedia.org