Exeter City Council is the local authority for Exeter in Devon, England. One third of the council is elected each year, followed by one year without election.
Council elections
- 1973 Exeter City Council election
- 1976 Exeter City Council election
- 1979 Exeter City Council election
- 1983 Exeter City Council election (New ward boundaries) [1]
- 1984 Exeter City Council election
- 1986 Exeter City Council election
- 1987 Exeter City Council election
- 1988 Exeter City Council election (City boundary changes took place but the number of seats remained the same) [2]
- 1990 Exeter City Council election
- 1991 Exeter City Council election
- 1992 Exeter City Council election
- 1994 Exeter City Council election
- 1995 Exeter City Council election
- 1996 Exeter City Council election
- 1998 Exeter City Council election
- 1999 Exeter City Council election
- 2000 Exeter City Council election (New ward boundaries) [3]
- 2002 Exeter City Council election
- 2003 Exeter City Council election
- 2004 Exeter City Council election
- 2006 Exeter City Council election
- 2007 Exeter City Council election
- 2008 Exeter City Council election
- 2010 Exeter City Council election (By-elections in 12 wards were held in September following a High Court ruling) [4]
- 2011 Exeter City Council election
- 2012 Exeter City Council election
- 2014 Exeter City Council election
- 2015 Exeter City Council election
- 2016 Exeter City Council election (New ward boundaries) [5]
- 2018 Exeter City Council election
- 2019 Exeter City Council election
- 2021 Exeter City Council election
- 2022 Exeter City Council election
- 2023 Exeter City Council election
Result maps
-
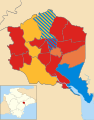 2000 results map
 -
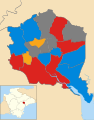
 2002 results map
 -
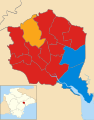
 2003 results map
 -
 2004 results map
 -
 2006 results map
 -
 2007 results map
 -
 2008 results map
 -
 2010 results map
 -
 2011 results map
 -
 2012 results map
 -
 2014 results map
 -
 2015 results map
 -
 2016 results map
 -
 2018 results map
 -
 2019 results map
 -
 2021 results map
 -
 2022 results map
 -
 2023 results map


By-election results
| Party | Candidate | Votes | % | ±% | |
|---|---|---|---|---|---|
| Liberal Democrats | Sheila Hobden | 504 | 47.1 | -0.5 | |
| Conservative | Graham Stone | 392 | 36.7 | +4.0 | |
| Labour | Dominic O'Brien | 93 | 8.7 | -2.1 | |
| Green | Isaac Price-Sosner | 80 | 7.5 | -1.4 | |
| Majority | 112 | 10.4 | |||
| Turnout | 1,069 | 25.5 | |||
| Liberal Democrats hold | Swing | ||||
| Party | Candidate | Votes | % | ±% | |
|---|---|---|---|---|---|
| Liberal Democrats | Natalie Cole | 1,171 | 39.6 | +11.5 | |
| Labour | John Poat | 746 | 25.3 | -10.1 | |
| Conservative | Simon Smith | 648 | 21.9 | -0.8 | |
| Green | Isaac Price-Sosner | 389 | 13.2 | +0.9 | |
| Majority | 425 | 14.3 | |||
| Turnout | 2,954 | 60.9 | |||
| Liberal Democrats gain from Labour | Swing | ||||
| Party | Candidate | Votes | % | ±% | |
|---|---|---|---|---|---|
| Liberal Democrats | Alexandra Newcombe | 890 | 45.4 | -9.1 | |
| Conservative | Margaret Jordan | 703 | 35.8 | +8.0 | |
| Labour | Paul Bull | 227 | 11.6 | -6.0 | |
| Green | Andrew Bell | 142 | 7.2 | +7.2 | |
| Majority | 187 | 9.6 | |||
| Turnout | 1,962 | 30.4 | |||
| Liberal Democrats hold | Swing | ||||
| Party | Candidate | Votes | % | ±% | |
|---|---|---|---|---|---|
| Liberal Democrats | Timothy Payne | 1,391 | |||
| Conservative | David Thompson | 913 | |||
| Labour | Bernard Dugdale | 491 | |||
| UKIP | David Smith | 152 | |||
| Green | Isaac Price-Sosner | 88 | |||
| Majority | |||||
| Turnout | 3,058 | 71.57% | |||
| Liberal Democrats hold | Swing | ||||
| Party | Candidate | Votes | % | ±% | |
|---|---|---|---|---|---|
| Conservative | Cynthia Thompson | 755 | |||
| Labour | David Harvey | 749 | |||
| UKIP | Alison Sheridan | 143 | |||
| Liberal Democrats | Michael Payne | 63 | |||
| Green | John Moreman | 62 | |||
| Independent | David Smith | 11 | |||
| Majority | |||||
| Turnout | 1,758 | 34.72% | |||
| Conservative hold | Swing | ||||
| Party | Candidate | Votes | % | ±% | |
|---|---|---|---|---|---|
| Labour | Heather Morris | 1,376 | |||
| Liberal Democrats | Adrian Fullam | 863 | |||
| Conservative | Alexandre Pierre-Traves | 628 | |||
| Green | Joseph Levy | 197 | |||
| UKIP | Alison Sheridan | 73 | |||
| Majority | |||||
| Turnout | 3,144 | 42.43% | |||
| Labour hold | Swing | ||||
| Party | Candidate | Votes | % | ±% | |
|---|---|---|---|---|---|
| Labour | Matthew Vizard | 1,044 | 54.6 | +5.0 | |
| Conservative | Lucille Baker | 512 | 26.8 | +3.3 | |
| Liberal Democrats | Alexandra Newcombe | 179 | 9.4 | +2.4 | |
| Green | Tom Milburn | 137 | 7.2 | -4.8 | |
| UKIP | Alison Sheridan | 40 | 2.1 | -2.8 | |
| Majority | 532 | 27.8 | |||
| Turnout | 1,912 | ||||
| Labour hold | Swing | ||||
| Party | Candidate | Votes | % | ±% | |
|---|---|---|---|---|---|
| Conservative | Keith Sparkes | 2,315 | 42.5% | -4.5% | |
| Labour | Ivan Jordan | 1,713 | 31% | +1.1% | |
| Liberal Democrats | Christine Campion | 1,106 | 20% | +14.7 | |
| For Britain | Frankie Rufolo | 245 | 4.5% | +4.5% | |
| Majority | |||||
| Turnout | 5442 | 73.97% | |||
| Conservative hold | Swing | ||||
References
- ^ "The City of Exeter (Electoral Arrangements) Order 1979". legislation.gov.uk. Retrieved 19 November 2015.
- ^ "The Devon (District Boundaries) Order 1987". legislation.gov.uk. Retrieved 6 November 2015.
- ^ "The City of Exeter (Electoral Changes) Order 1999". legislation.gov.uk. Retrieved 4 October 2015.
- ^ "September by-elections for Exeter and Norwich". BBC. Retrieved 3 May 2016.
- ^ "The Exeter (Electoral Changes) Order 2016". legislation.gov.uk. Retrieved 20 April 2016.
- ^ "Election of City Councillorsfor the Wards of Exeter City Council Summary of Results" (PDF). Exeter City Council. 6 May 2010.
- ^ "Election of City Councillorsfor the Wards of Exeter City Council Summary of Results" (PDF). Exeter City Council. 13 August 2015.
- ^ "Election of City Councillorsfor the Wards of Exeter City Council Summary of Results" (PDF). Exeter City Council. 4 May 2017.
- ^ "Local Elections Archive Project — Newtown and St Leonard's Ward". www.andrewteale.me.uk. Retrieved 2 December 2023.
- ^ "Election of City Councillorsfor the Wards of Exeter City Council Summary of Results". Exeter City Council. 13 December 2019.