From Wikipedia, the free encyclopedia
Election
2005 Sri Lankan presidential election Turnout 73.73%
Presidential elections were held in
Sri Lanka on 17 November 2005. Nominations were accepted on 7 September 2005 and electoral participation was 73.73%.
Prime Minister
Mahinda Rajapaksa of the governing
United People's Freedom Alliance was elected, receiving 50.3% of all votes cast.
Presidential term controversy At first, there was doubt whether the election would be held at all. President
Chandrika Kumaratunga had called the
1999 election one year ahead of schedule; she argued that the extra year should be appended to her second term, and filed suit to do this. The
Supreme Court of Sri Lanka rejected her claims and the election went ahead.
Campaign Prime Minister Mahinda Rajapaksa quickly emerged as the candidate for the
Sri Lanka Freedom Party and Ranil Wickremesinghe for the
United National Party . Both candidates tried to round up the support of minor parties. Rajapaksa needed to re-assemble the alliance with the
Janatha Vimukthi Peramuna that existed at the parliamentary level (the
United People's Freedom Alliance ). After he agreed to reject
federalism and renegotiate the ceasefire with the
Liberation Tigers of Tamil Eelam , the JVP and the
Jathika Hela Urumaya endorsed him.
After that, Wickremesinghe's only hope of victory was through the support of the island's ethnic minorities, given his generally more conciliatory stance on the ethnic issue. He secured the endorsement of the main
Muslim party, the
Sri Lanka Muslim Congress , and the
Ceylon Workers' Congress representing the
estate Tamils . He could not, however, obtain the backing of the main
Sri Lankan Tamil party, the
Tamil National Alliance . Any hopes for Wickremesinghe's victory were effectively dashed when the LTTE ordered Tamil voters, most of whom would likely have voted for him, to boycott the polls.
Economic issues also worked to Rajapaksa's favour. Sri Lanka had enjoyed strong growth under Wickremesinghe's free-market policies when he was prime minister from 2001 to 2004, but he had also pursued controversial
privatizations which Rajapaksa promised to halt. Rajapaksa also promised a policy of
economic nationalism .
Results Candidate Party Votes %
Mahinda Rajapaksa
Sri Lanka Freedom Party 4,887,152 50.29
Ranil Wickremesinghe
United National Party 4,706,366 48.43
Siritunga Jayasuriya
United Socialist Party 35,425 0.36 A. A. Suraweera National Development Front 31,238 0.32
Victor Hettigoda United Lanka People's Party 14,458 0.15 Chamil Jayaneththi
New Left Front 9,296 0.10 Aruna de Soyza Ruhuna People's Party 7,685 0.08 Wimal Geeganage
Sri Lanka National Front 6,639 0.07 Anura de Silva United Lalith Front 6,357 0.07 Ajith Arachchige
Democratic Unity Alliance 5,082 0.05 Wije Dias
Socialist Equality Party 3,500 0.04 Nelson Perera
Sri Lanka Progressive Front 2,525 0.03 Hewaheenipellage Dharmadwaja United National Alternative Front 1,316 0.01 Total 9,717,039 100.00 Valid votes 9,717,039 98.88 Invalid/blank votes 109,739 1.12 Total votes 9,826,778 100.00 Registered voters/turnout 13,327,160 73.73 Source:
Election Commission
District results
Summary of the 2005 Sri Lankan presidential election by electoral district
[1]
District
Province
Rajapaksa
Wickremesinghe
Others
Turnout
Votes
%
Votes
%
Votes
%
Colombo
Western
534,431
47.96%
569,627
51.12%
10,192
0.92%
76.75%
Gampaha
Western
596,698
54.78%
481,764
44.23%
10,815
0.99%
80.71%
Kalutara
Western
341,693
55.48%
266,043
43.20%
8,124
1.32%
81.43%
Kandy
Central
315,672
44.30%
387,150
54.33%
9,798
1.37%
79.65%
Matale
Central
120,533
48.09%
125,937
50.25%
4,150
1.66%
79.04%
Nuwara Eliya
Central
99,550
27.97%
250,428
70.37%
5,897
1.66%
80.78%
Galle
Southern
347,223
58.41%
239320
40.26%
7,925
1.33%
81.94%
Matara
Southern
279411
61.85%
165827
36.71%
6,484
1.44%
80.96%
Hambantota
Southern
202,918
63.43%
112,712
35.23%
4,295
1.34%
81.41%
Jaffna
Northern
1,967
25.00%
5,523
70.20%
1,034
4.8%
1.21%
Vanni
Northern
17,197
20.36%
65,798
77.89%
2,879
1.75%
34.30%
Batticaloa
Eastern
28,836
18.87%
121,514
79.51%
4,265
1.62%
48.51%
Ampara
Eastern
122,329
42.88%
159,198
55.81%
6,681
1.31%
72.7%
Trincomalee
Eastern
55,680
37.04%
92,197
61.33%
4,551
1.63%
63.84%
Kurunegala
North Western
468,507
52.56%
418,809
46.72%
17,639
0.72%
80.51%
Puttalam
North Western
160,686
48.14%
169,264
50.71%
3,833
1.15%
71.68%
Anuradhapura
North Central
231,040
55.08%
182,956
42.62%
5,438
2.3%
78.98%
Polonnaruwa
North Central
110,499
52.61%
97,142
46.25%
2,389
1.14%
80.43%
Badulla
Uva
192,734
45.18%
226,582
53.11%
7,283
1.71%
81.29%
Monaragala
Uva
126,094
56.94%
92,244
41.65%
3,112
1.41%
81.16%
Ratnapura
Sabaragamuwa
294,260
53.01%
252,838
45.55%
7,976
1.44%
83.89%
Kegalle
Sabaragamuwa
239,184
51.02%
223,483
47.67%
6,106
1.31%
81.19%
Total
4,887,152
50.29%
4,706,366
48.43%
123,521
1.28%
73.73%
Maps
Winners of polling divisions
Majorities according to polling divisions
Majorities according to electoral districts
References
Direct elections Indirect elections
Presidency Premierships Electoral history
Parliamentary
Presidential
Family Related

.jpg)
 Winners of polling divisions
 Majorities according to polling divisions
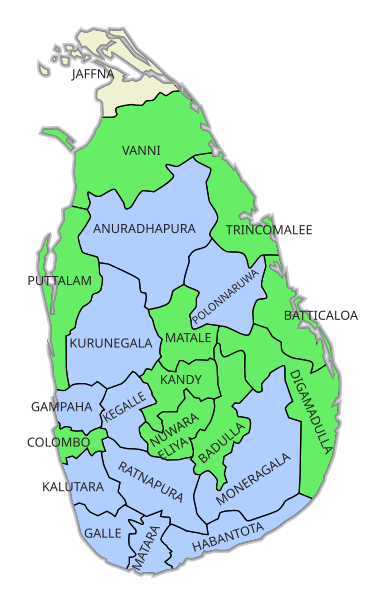 Majorities according to electoral districts


